

Question: 10. The table shows time series data for the population of two Ontario towns. Year Collingwood Grimsby 1991 14 382 13 520 | 1995 15
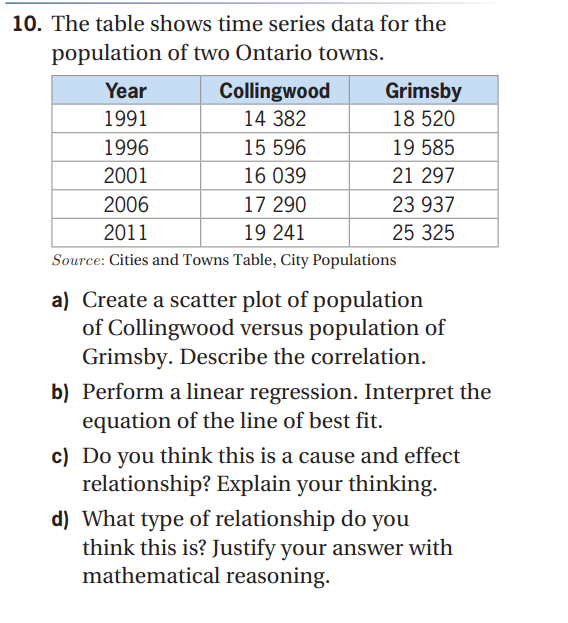
10. The table shows time series data for the population of two Ontario towns. Year Collingwood Grimsby 1991 14 382 13 520 | 1995 15 595 19 535 l 2001 15 039 21 297 | 2006 17 290 23 937 l 2011 19 241 25 325 Source: Cities and Towns Table, City Populations a) Create a scatter plot of population of Collingwood versus population of Grimsby. Describe the correlation. b] Perform a linear regression. Interpret the equation of the line of best t. c) Do you think this is a cause and effect relationship? Explain your thinking. d) What type of relationship do you think this is? Justify your answer with mathematical reasoning
Step by Step Solution
There are 3 Steps involved in it
1 Expert Approved Answer
Step: 1 Unlock

Question Has Been Solved by an Expert!
Get step-by-step solutions from verified subject matter experts
Step: 2 Unlock
Step: 3 Unlock