

Question: 10) Use the heating/cooling graph to complete the following chart: Heating Curve Unknown Substance 120 100 60 80 60 60 Temperature (C) 40 20
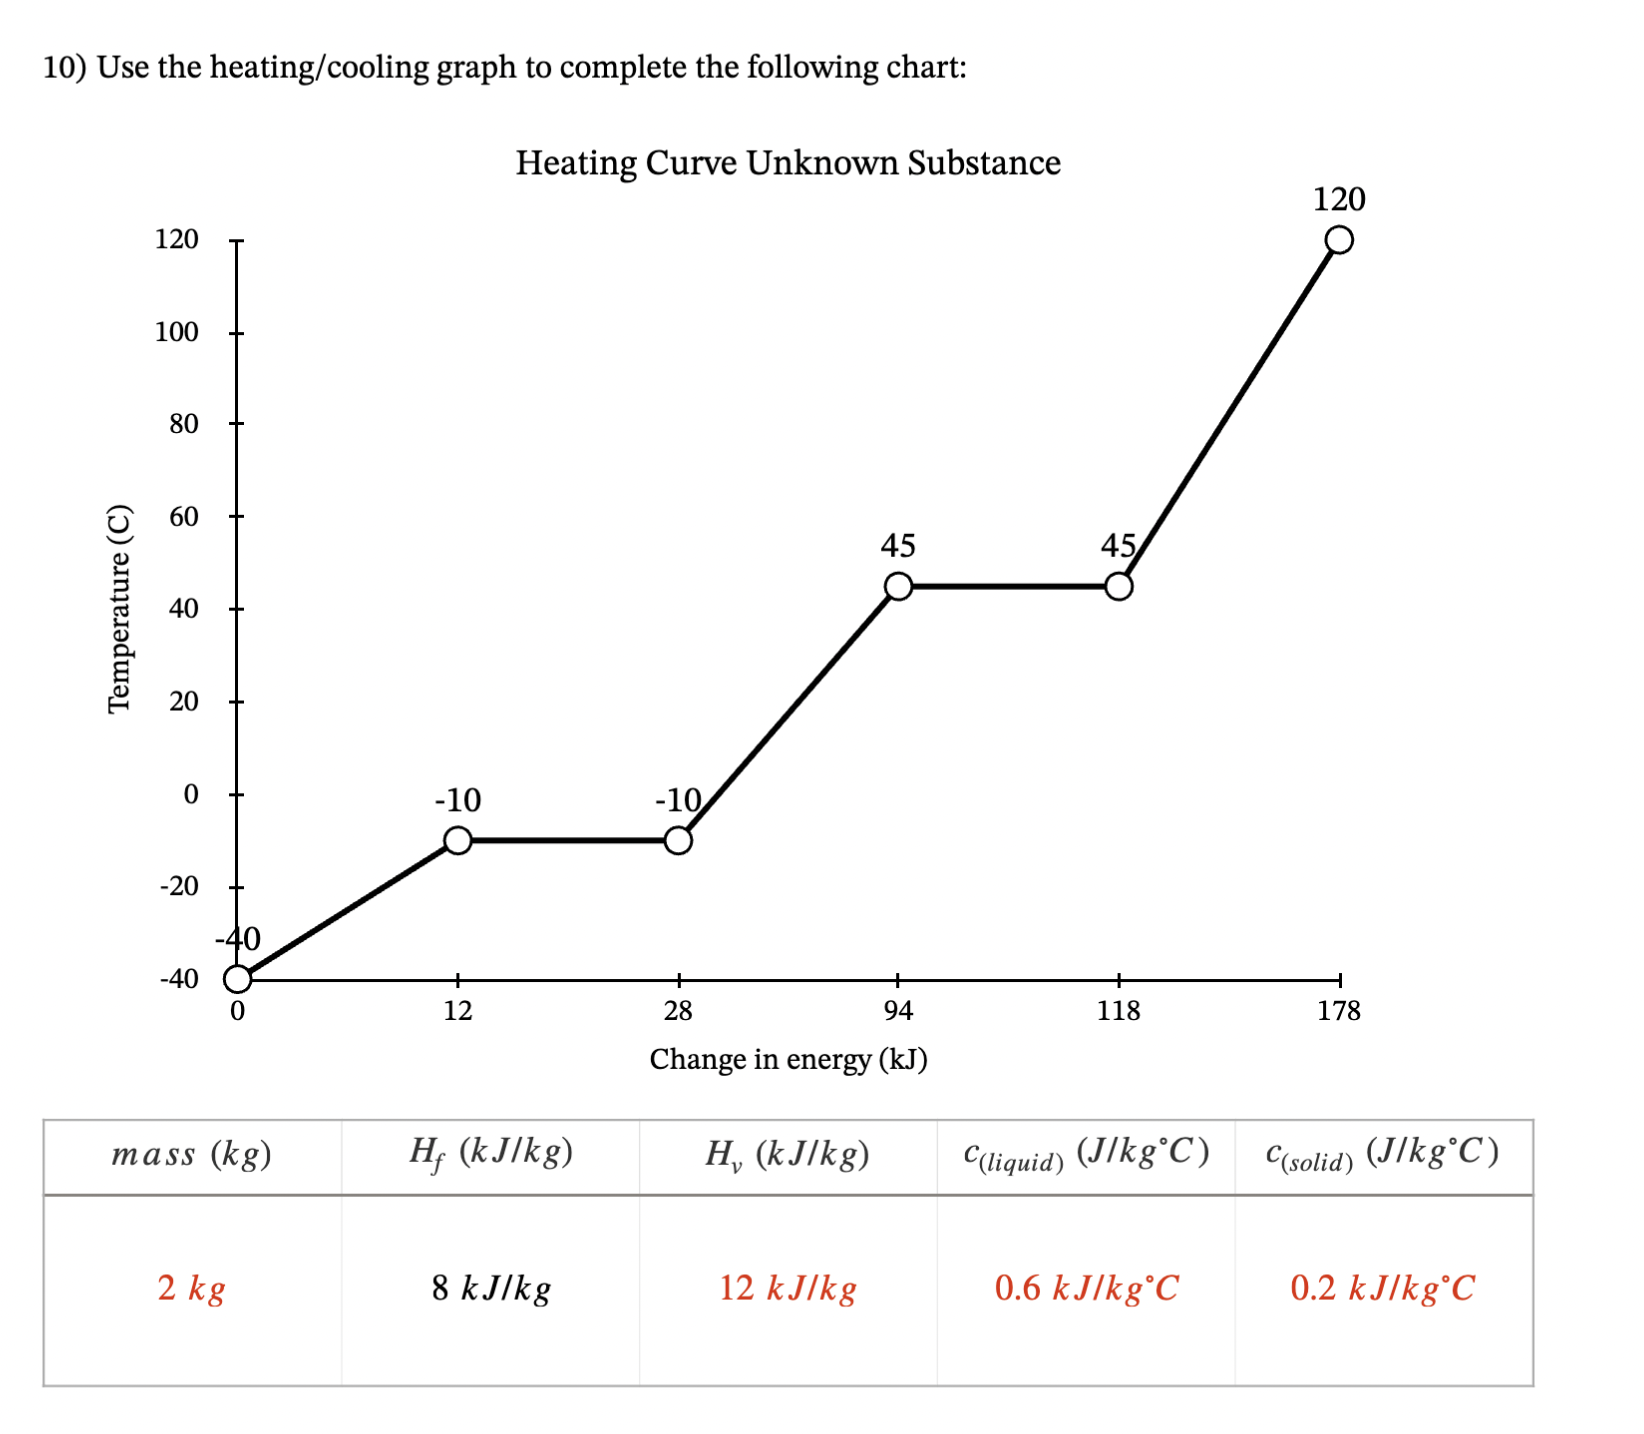
10) Use the heating/cooling graph to complete the following chart: Heating Curve Unknown Substance 120 100 60 80 60 60 Temperature (C) 40 20 20 0 -10 -10 -20 20 -40 45 45 200 120 + 94 118 178 Change in energy (kJ) 0 12 + 28 mass (kg) Hf (kJ/kg) H (kJ/kg) C(liquid) (J/kgC) C(solid) (J/kgC) 2 kg 8 kJ/kg 12 kJ/kg 0.6 kJ/kgC 0.2 kJ/kgC
Step by Step Solution
There are 3 Steps involved in it
1 Expert Approved Answer
Step: 1 Unlock

Question Has Been Solved by an Expert!
Get step-by-step solutions from verified subject matter experts
Step: 2 Unlock
Step: 3 Unlock