

Question: 10. Using Excel Sheet 01, use pivot table tool and make exact below graph and table with all details presented. 120 100 80 60 Min
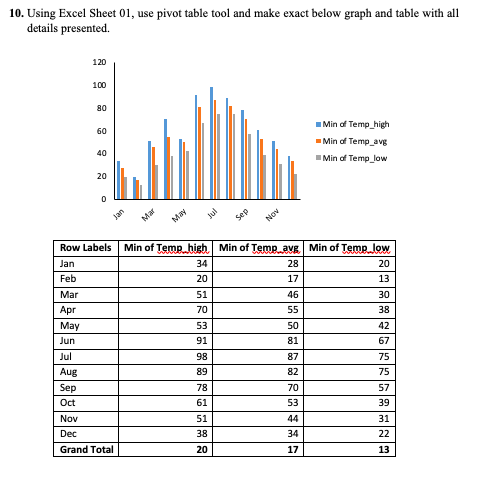
10. Using Excel Sheet 01, use pivot table tool and make exact below graph and table with all details presented. 120 100 80 60 Min of Temp_high - Min of Temp_avg Min of Temp_low 40 20 0 jan Mar May Jul Sep NOY Row Labels Jan Feb Mar Apr May Jun Jul Aug Sep Min of Temp high Min of Temp avg Min of Temp.low 34 28 20 20 17 13 51 46 30 70 55 38 53 50 42 91 81 67 98 87 75 89 82 75 78 70 57 61 53 39 51 44 31 38 34 22 20 17 13 Oct I Nov Dec Grand Total
Step by Step Solution
There are 3 Steps involved in it
1 Expert Approved Answer
Step: 1 Unlock

Question Has Been Solved by an Expert!
Get step-by-step solutions from verified subject matter experts
Step: 2 Unlock
Step: 3 Unlock