

Question: 10 X 0 Data Table each year. te sheet for place, X.X% Delta Designs, Inc. Comparative Balance Sheet December 31, 2018 and 2017 ns, Inc.
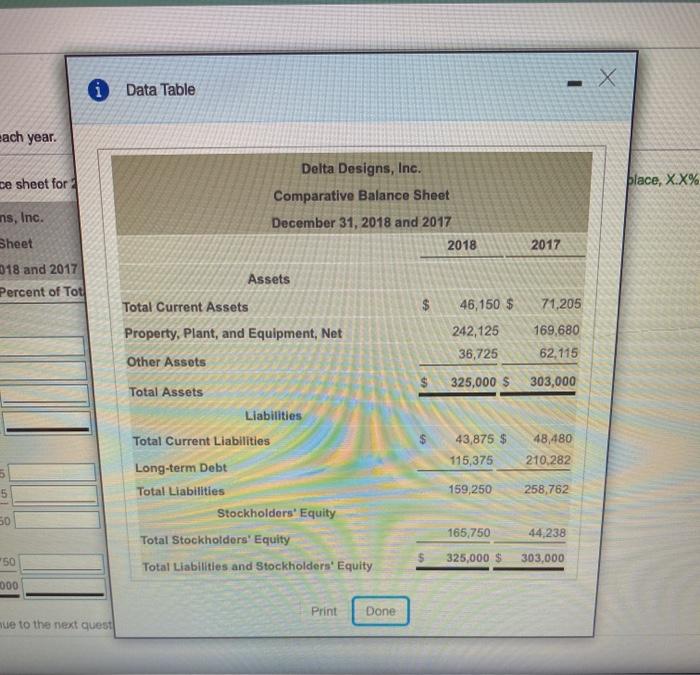
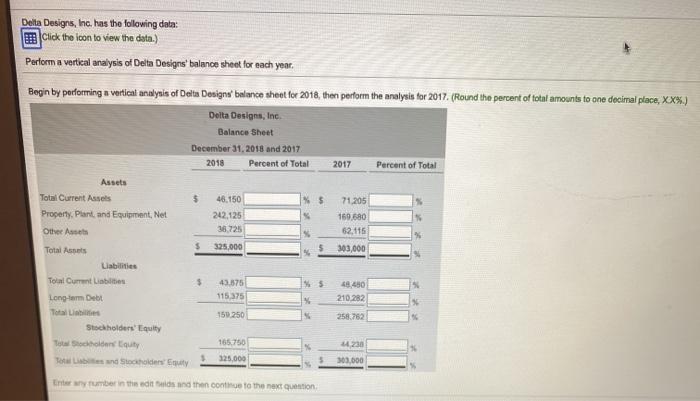
X 0 Data Table each year. te sheet for place, X.X% Delta Designs, Inc. Comparative Balance Sheet December 31, 2018 and 2017 ns, Inc. Sheet 2018 2017 18 and 2017 Percent of Tot 71,205 Assets Total Current Assets Property, Plant, and Equipment, Net Other Assets 46,150 $ 242,125 36,725 169,680 62,115 325,000 $ 303,000 Total Assets Liabilities 43,875 $ 115,375 48,480 210,282 5 5 159,250 258,762 Total Current Liabilities Long-term Debt Total Liabilities Stockholders' Equity Total Stockholders' Equity Total Liabilities and Stockholders' Equity 50 165,750 44.238 *50 325,000 $ 303,000 000 Print Done mue to the next quest Delta Designs, Inc. has the following data: click the icon to view the data.) Perform a vertical analysis of Delta Designs' balance sheet for each year, Begin by performing a vertical analysis of Delta Designa balance sheet for 2018, then perform the analysis for 2017. (Round the percent of total amounts to one decimal place, XX%) Delta Designs, Inc Balance Sheet December 31, 2018 and 2017 2018 Percent of Total 2017 Percent of Total Assets Total Current Assels 3 48.150 %$ 71.205 Property, Plant and Equipment, Net 242,125 169,680 36.725 Others 62.115 $ 325,000 Total Assets 303,000 Liabilities Total Current Labies $ 45.575 48.480 Long-term Debt 115.375 210.282 Total 150 250 258.762 Stockholders' Equity To Schond quity 165.750 230 To be and Stockholders 325,000 303.000 45 % nyumber in the end and then conto the next quoti
Step by Step Solution
There are 3 Steps involved in it

Get step-by-step solutions from verified subject matter experts