

Question: 100% + Graphing Assignment # 1- check BB for due date - This is copyrighted material You are writing a paper for your Quantitative Analysis
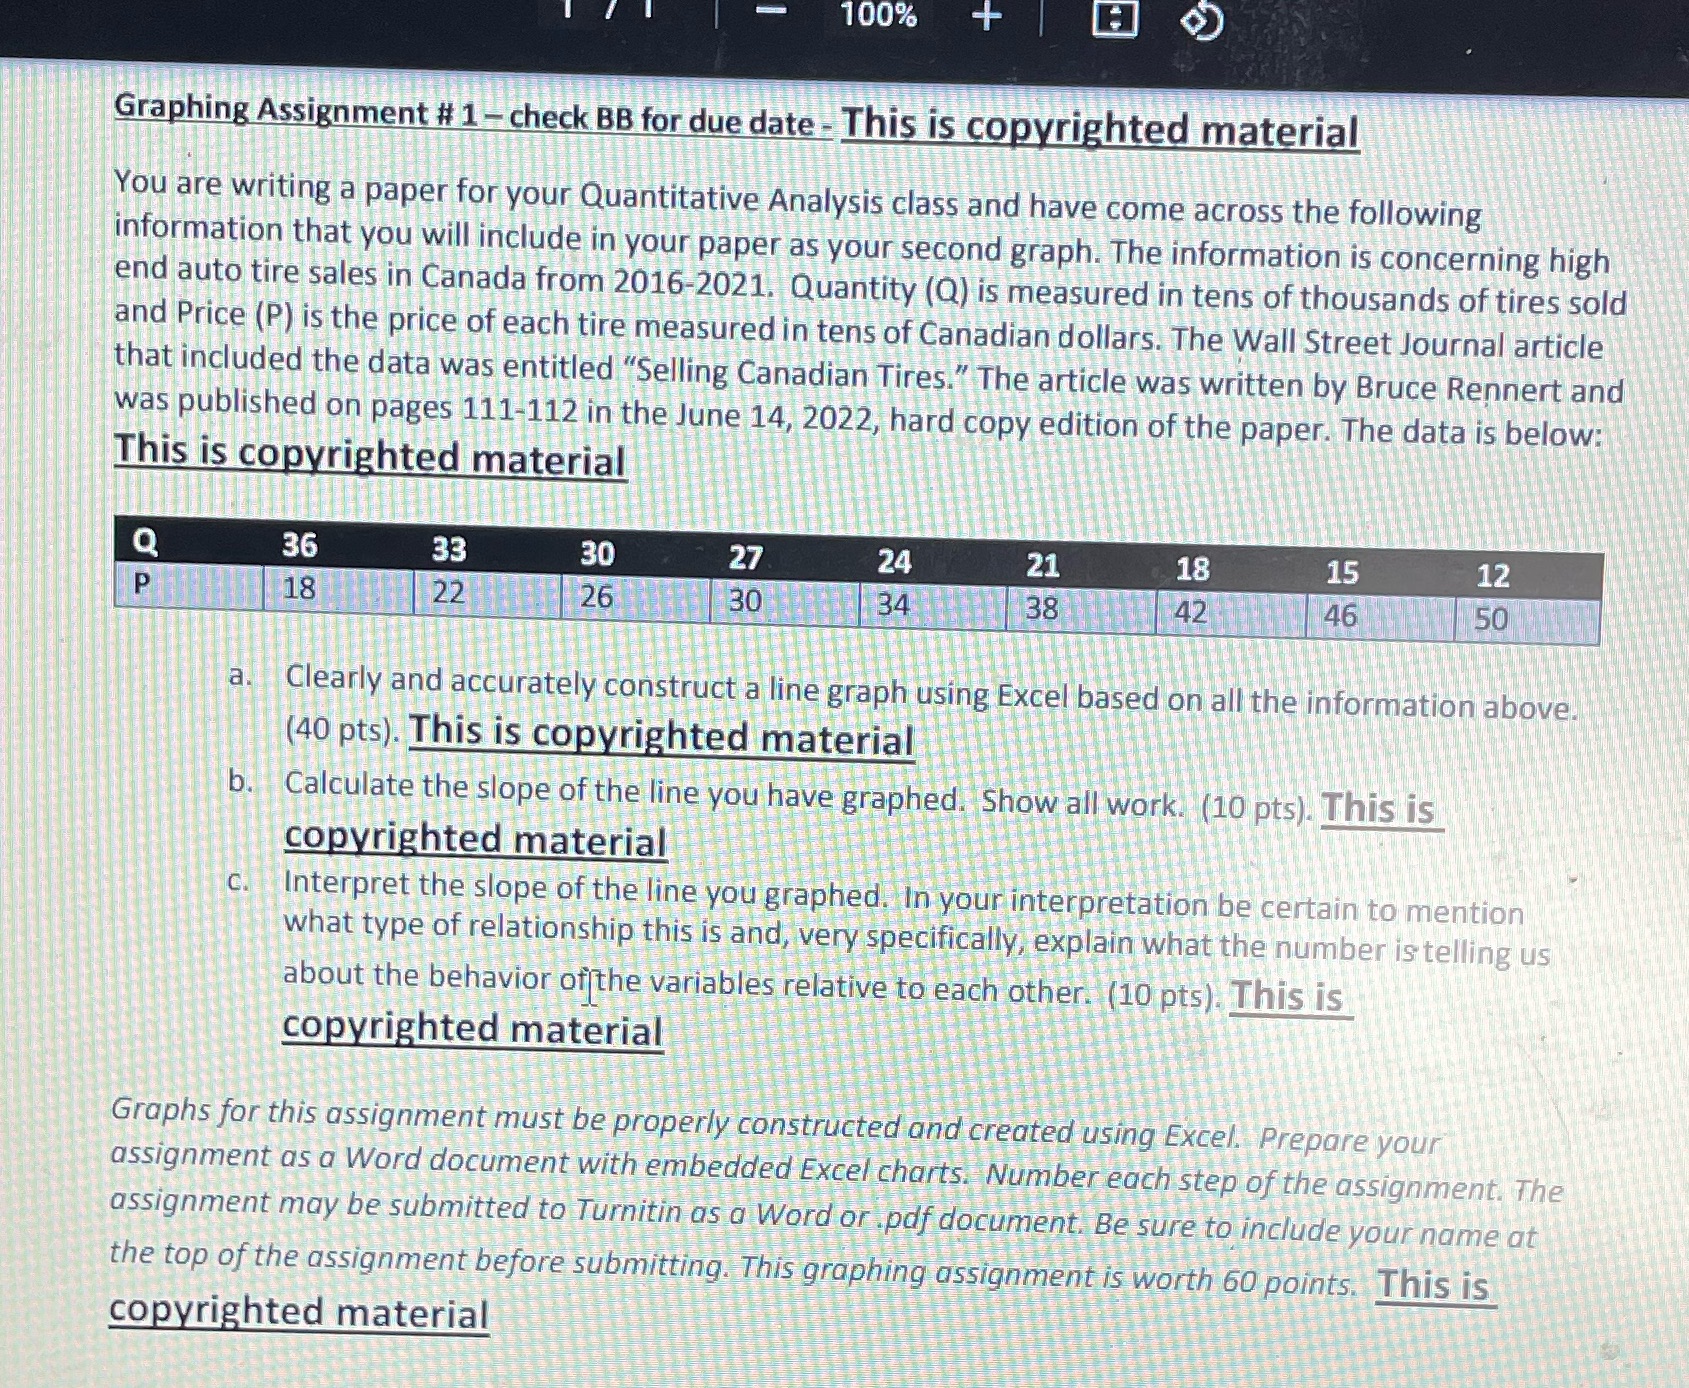
100% + Graphing Assignment # 1- check BB for due date - This is copyrighted material You are writing a paper for your Quantitative Analysis class and have come across the following information that you will include in your paper as your second graph. The information is concerning high end auto tire sales in Canada from 2016-2021, Quantity (Q) is measured in tens of thousands of tires sold and Price (P) is the price of each tire measured in tens of Canadian dollars. The Wall Street Journal article that included the data was entitled "Selling Canadian Tires." The article was written by Bruce Rennert and was published on pages 111-112 in the June 14, 2022, hard copy edition of the paper. The data is below: This is copyrighted material Q 36 33 30 27 24 21 18 15 12 P 18 22 26 30 34 38 42 46 50 a. Clearly and accurately construct a line graph using Excel based on all the information above. (40 pts). This is copyrighted material b. Calculate the slope of the line you have graphed. Show all work. (10 pts). This is copyrighted material c. Interpret the slope of the line you graphed. In your interpretation be certain to mention what type of relationship this is and, very specifically, explain what the number is telling us about the behavior of the variables relative to each other. (10 pts). This is copyrighted material Graphs for this assignment must be properly constructed and created using Excel. Prepare your assignment as a Word document with embedded Excel charts. Number each step of the assignment. The assignment may be submitted to Turnitin as a Word or pdf document. Be sure to include your name at the top of the assignment before submitting. This graphing assignment is worth 60 points. This is copyrighted material
Step by Step Solution
There are 3 Steps involved in it

Get step-by-step solutions from verified subject matter experts