

Question: 100 Market Gini coefficient: 0.47 90 Disposable Gini coefficient: 0.25 80 Perfect equality line Cumulative share of income (%) The following diagram shows the Lorenz
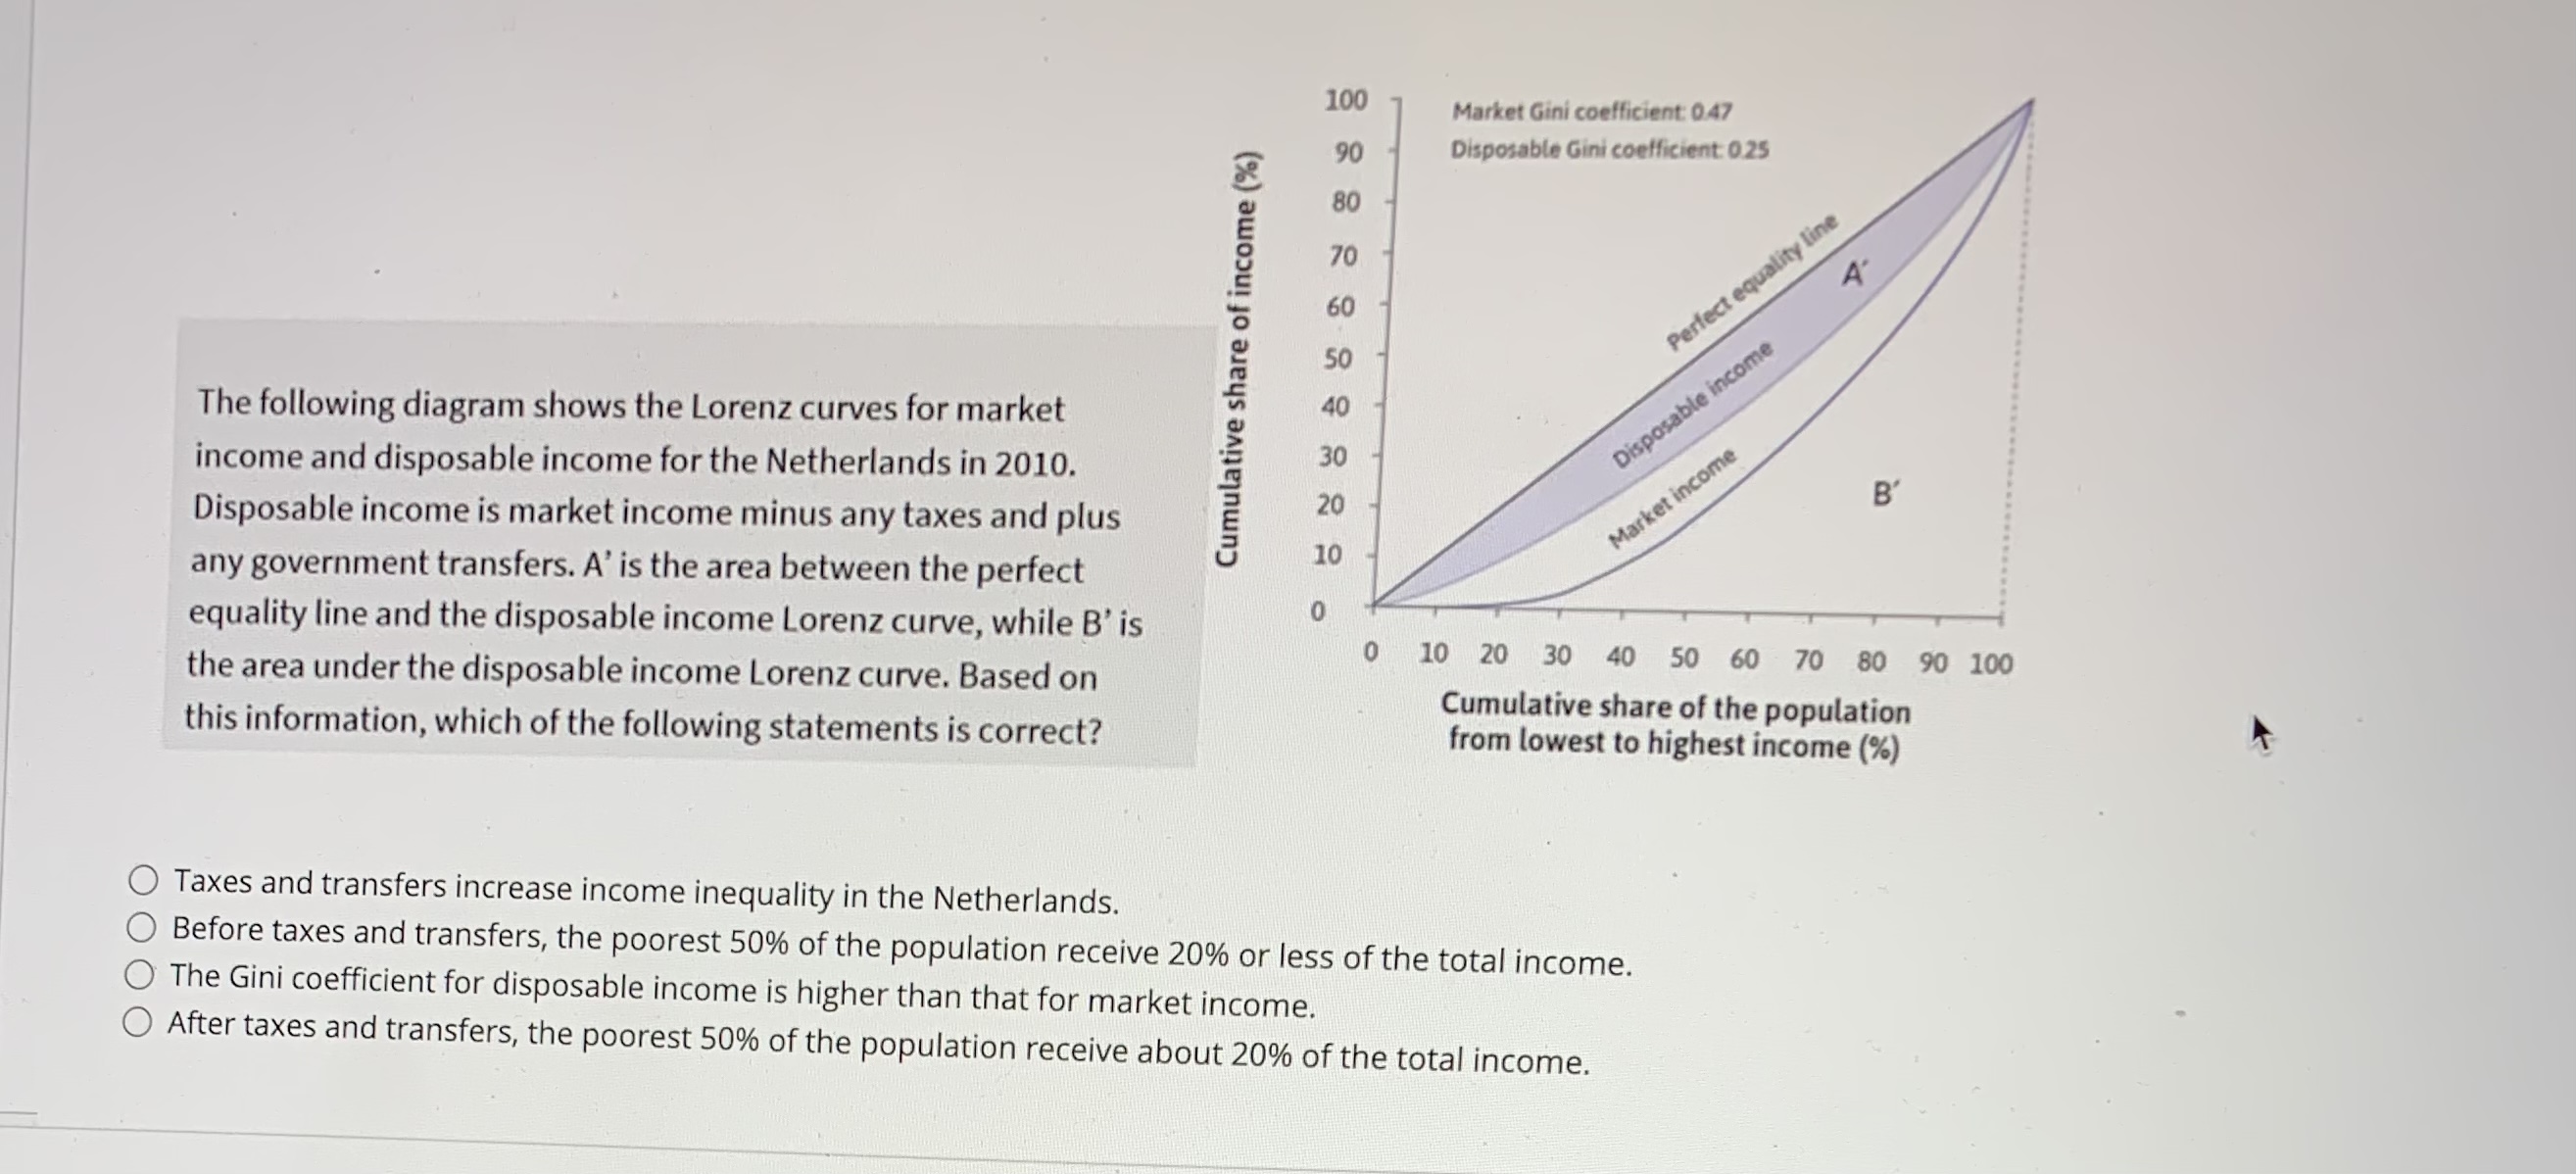
100 Market Gini coefficient: 0.47 90 Disposable Gini coefficient: 0.25 80 Perfect equality line Cumulative share of income (%) The following diagram shows the Lorenz curves for market Disposable income income and disposable income for the Netherlands in 2010. Market income B Disposable income is market income minus any taxes and plus any government transfers. A' is the area between the perfect equality line and the disposable income Lorenz curve, while B' is 0 10 20 30 40 50 60 70 80 90 100 the area under the disposable income Lorenz curve. Based on Cumulative share of the population this information, which of the following statements is correct? from lowest to highest income (%) O Taxes and transfers increase income inequality in the Netherlands. Before taxes and transfers, the poorest 50% of the population receive 20% or less of the total income. The Gini coefficient for disposable income is higher than that for market income. After taxes and transfers, the poorest 50% of the population receive about 20% of the total income
Step by Step Solution
There are 3 Steps involved in it

Get step-by-step solutions from verified subject matter experts