

Question: 10.1 PARTICIPATION: Function plotter This PARTICIPATION zyLab should be treated like a reading chapter in the other parts of the zyBook. Solutions are available
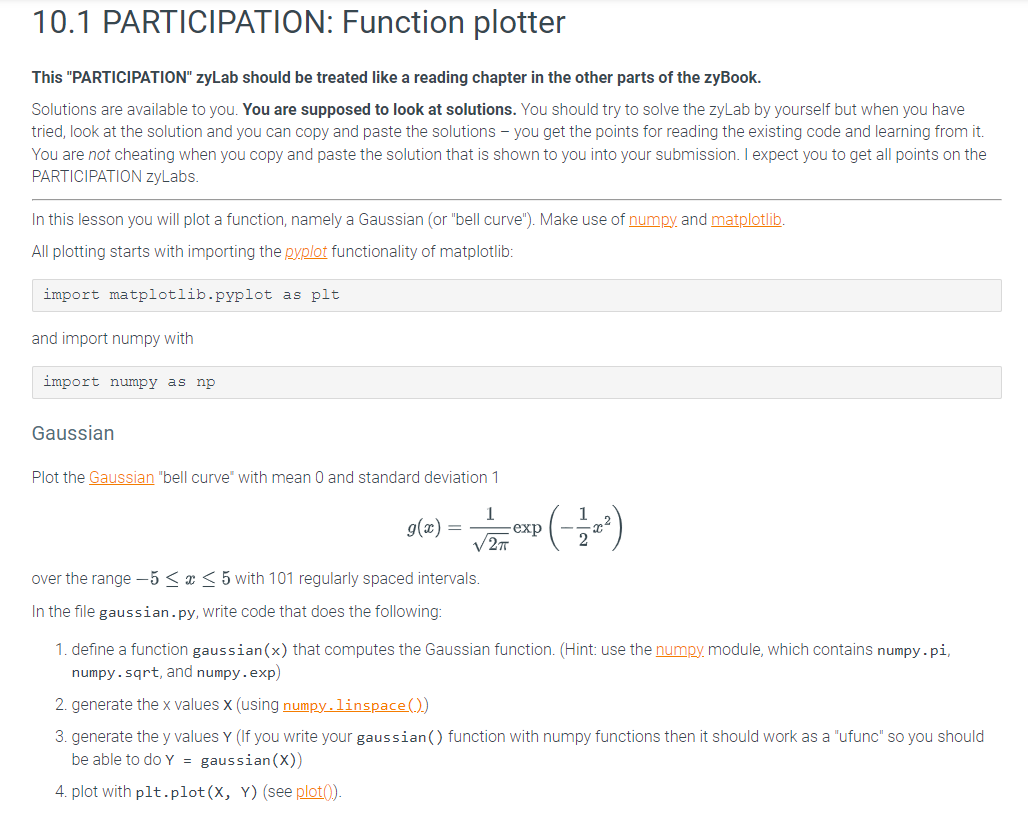
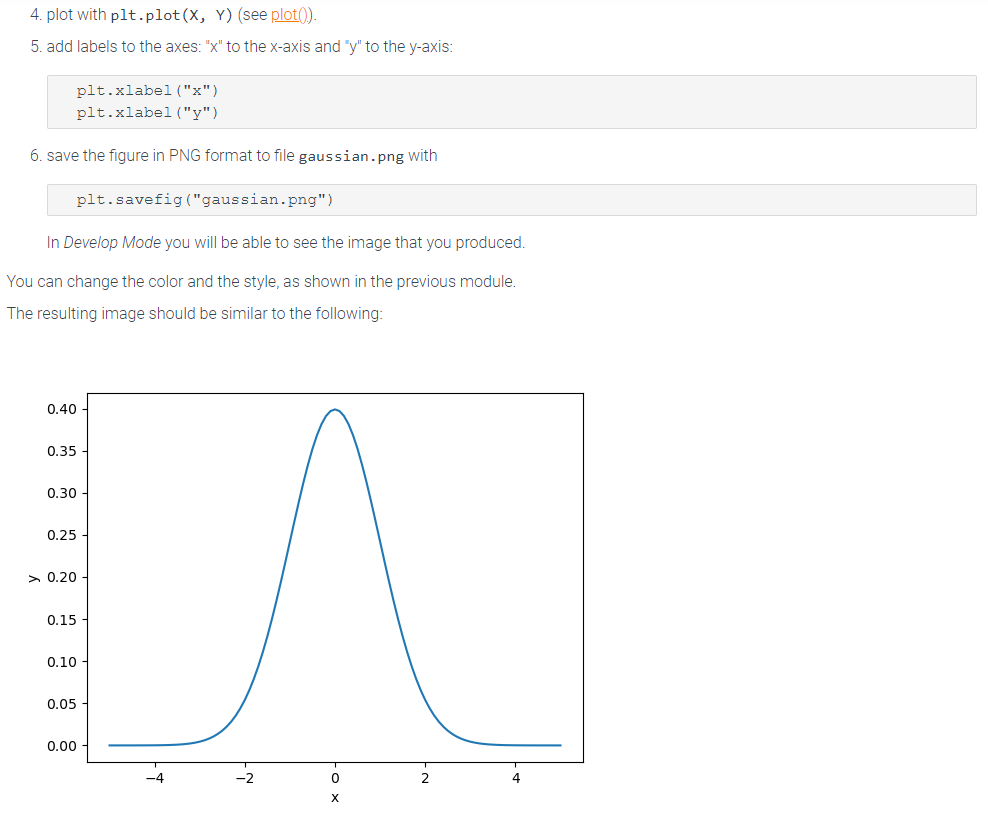
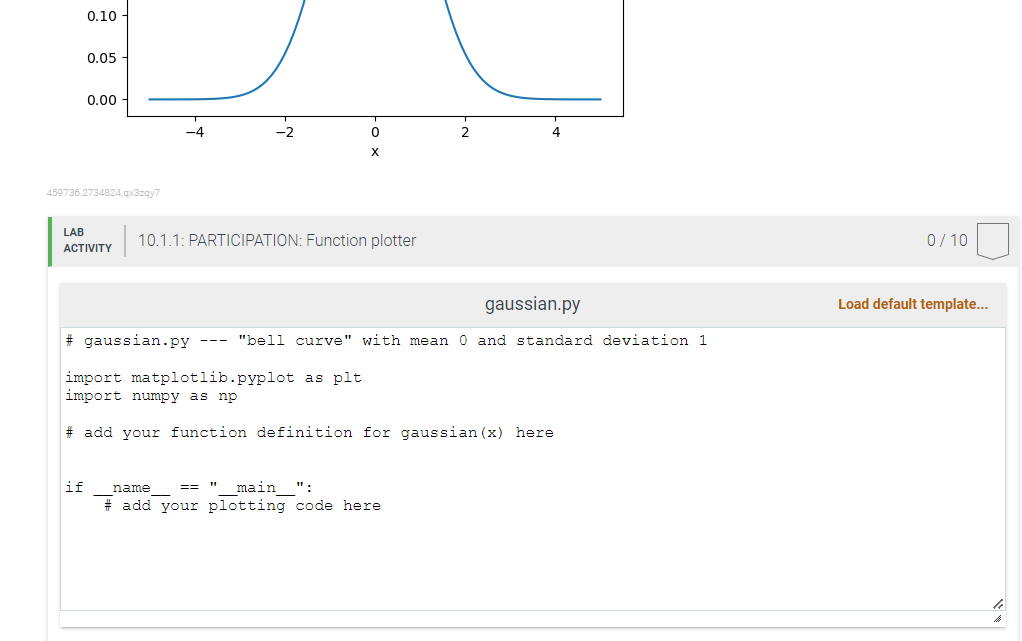
10.1 PARTICIPATION: Function plotter This "PARTICIPATION" zyLab should be treated like a reading chapter in the other parts of the zyBook. Solutions are available to you. You are supposed to look at solutions. You should try to solve the zyLab by yourself but when you have tried, look at the solution and you can copy and paste the solutions you get the points for reading the existing code and learning from it. You are not cheating when you copy and paste the solution that is shown to you into your submission. I expect you to get all points on the PARTICIPATION zyLabs. In this lesson you will plot a function, namely a Gaussian (or "bell curve"). Make use of numpy and matplotlib. All plotting starts with importing the pyplot functionality of matplotlib: import matplotlib.pyplot as plt and import numpy with import numpy as np Gaussian Plot the Gaussian "bell curve" with mean 0 and standard deviation 1 1 2 g(x) = over the range - 5 x 5 with 101 regularly spaced intervals. In the file gaussian.py, write code that does the following: (-/1/2) exp 1. define a function gaussian (x) that computes the Gaussian function. (Hint: use the numpy, module, which contains numpy.pi, numpy.sqrt, and numpy.exp) 2. generate the x values X (using numpy.linspace(.)) 3. generate the y values Y (If you write your gaussian () function with numpy functions then it should work as a "ufunc" so you should be able to do Y = gaussian (X)) 4. plot with plt.plot (X, Y) (see plot()). 4. plot with plt.plot(X, Y) (see plot()). 5. add labels to the axes: "x" to the x-axis and "y" to the y-axis: plt.xlabel ("x") plt.xlabel ("y") 6. save the figure in PNG format to file gaussian.png with plt.savefig ("gaussian.png") In Develop Mode you will be able to see the image that you produced. You can change the color and the style, as shown in the previous module. The resulting image should be similar to the following: 0.40 0.35 0.30 0.25 0.20 0.15 0.10 0.05 0.00 -4 -2 0 X 0.10 0.05 0.00 459736.2734824.qx3zqy7 LAB ACTIVITY if 10.1.1: PARTICIPATION: Function plotter #gaussian.py --- 2 gaussian.py "bell curve" with mean 0 and standard deviation 1 import matplotlib.pyplot as plt import numpy as np # add your function definition for gaussian (x) here name == "____main___": #add your plotting code here 0/10 Load default template...
Step by Step Solution
3.49 Rating (149 Votes )
There are 3 Steps involved in it
To plot the Gaussian bell curve with mean 0 and the function 9a over th... View full answer

Get step-by-step solutions from verified subject matter experts