

Question: 10.1.10-1 Question Help State A State B Sample mean $50,481 $48,200 Salary data from two random samples of high school teachers are shown to the
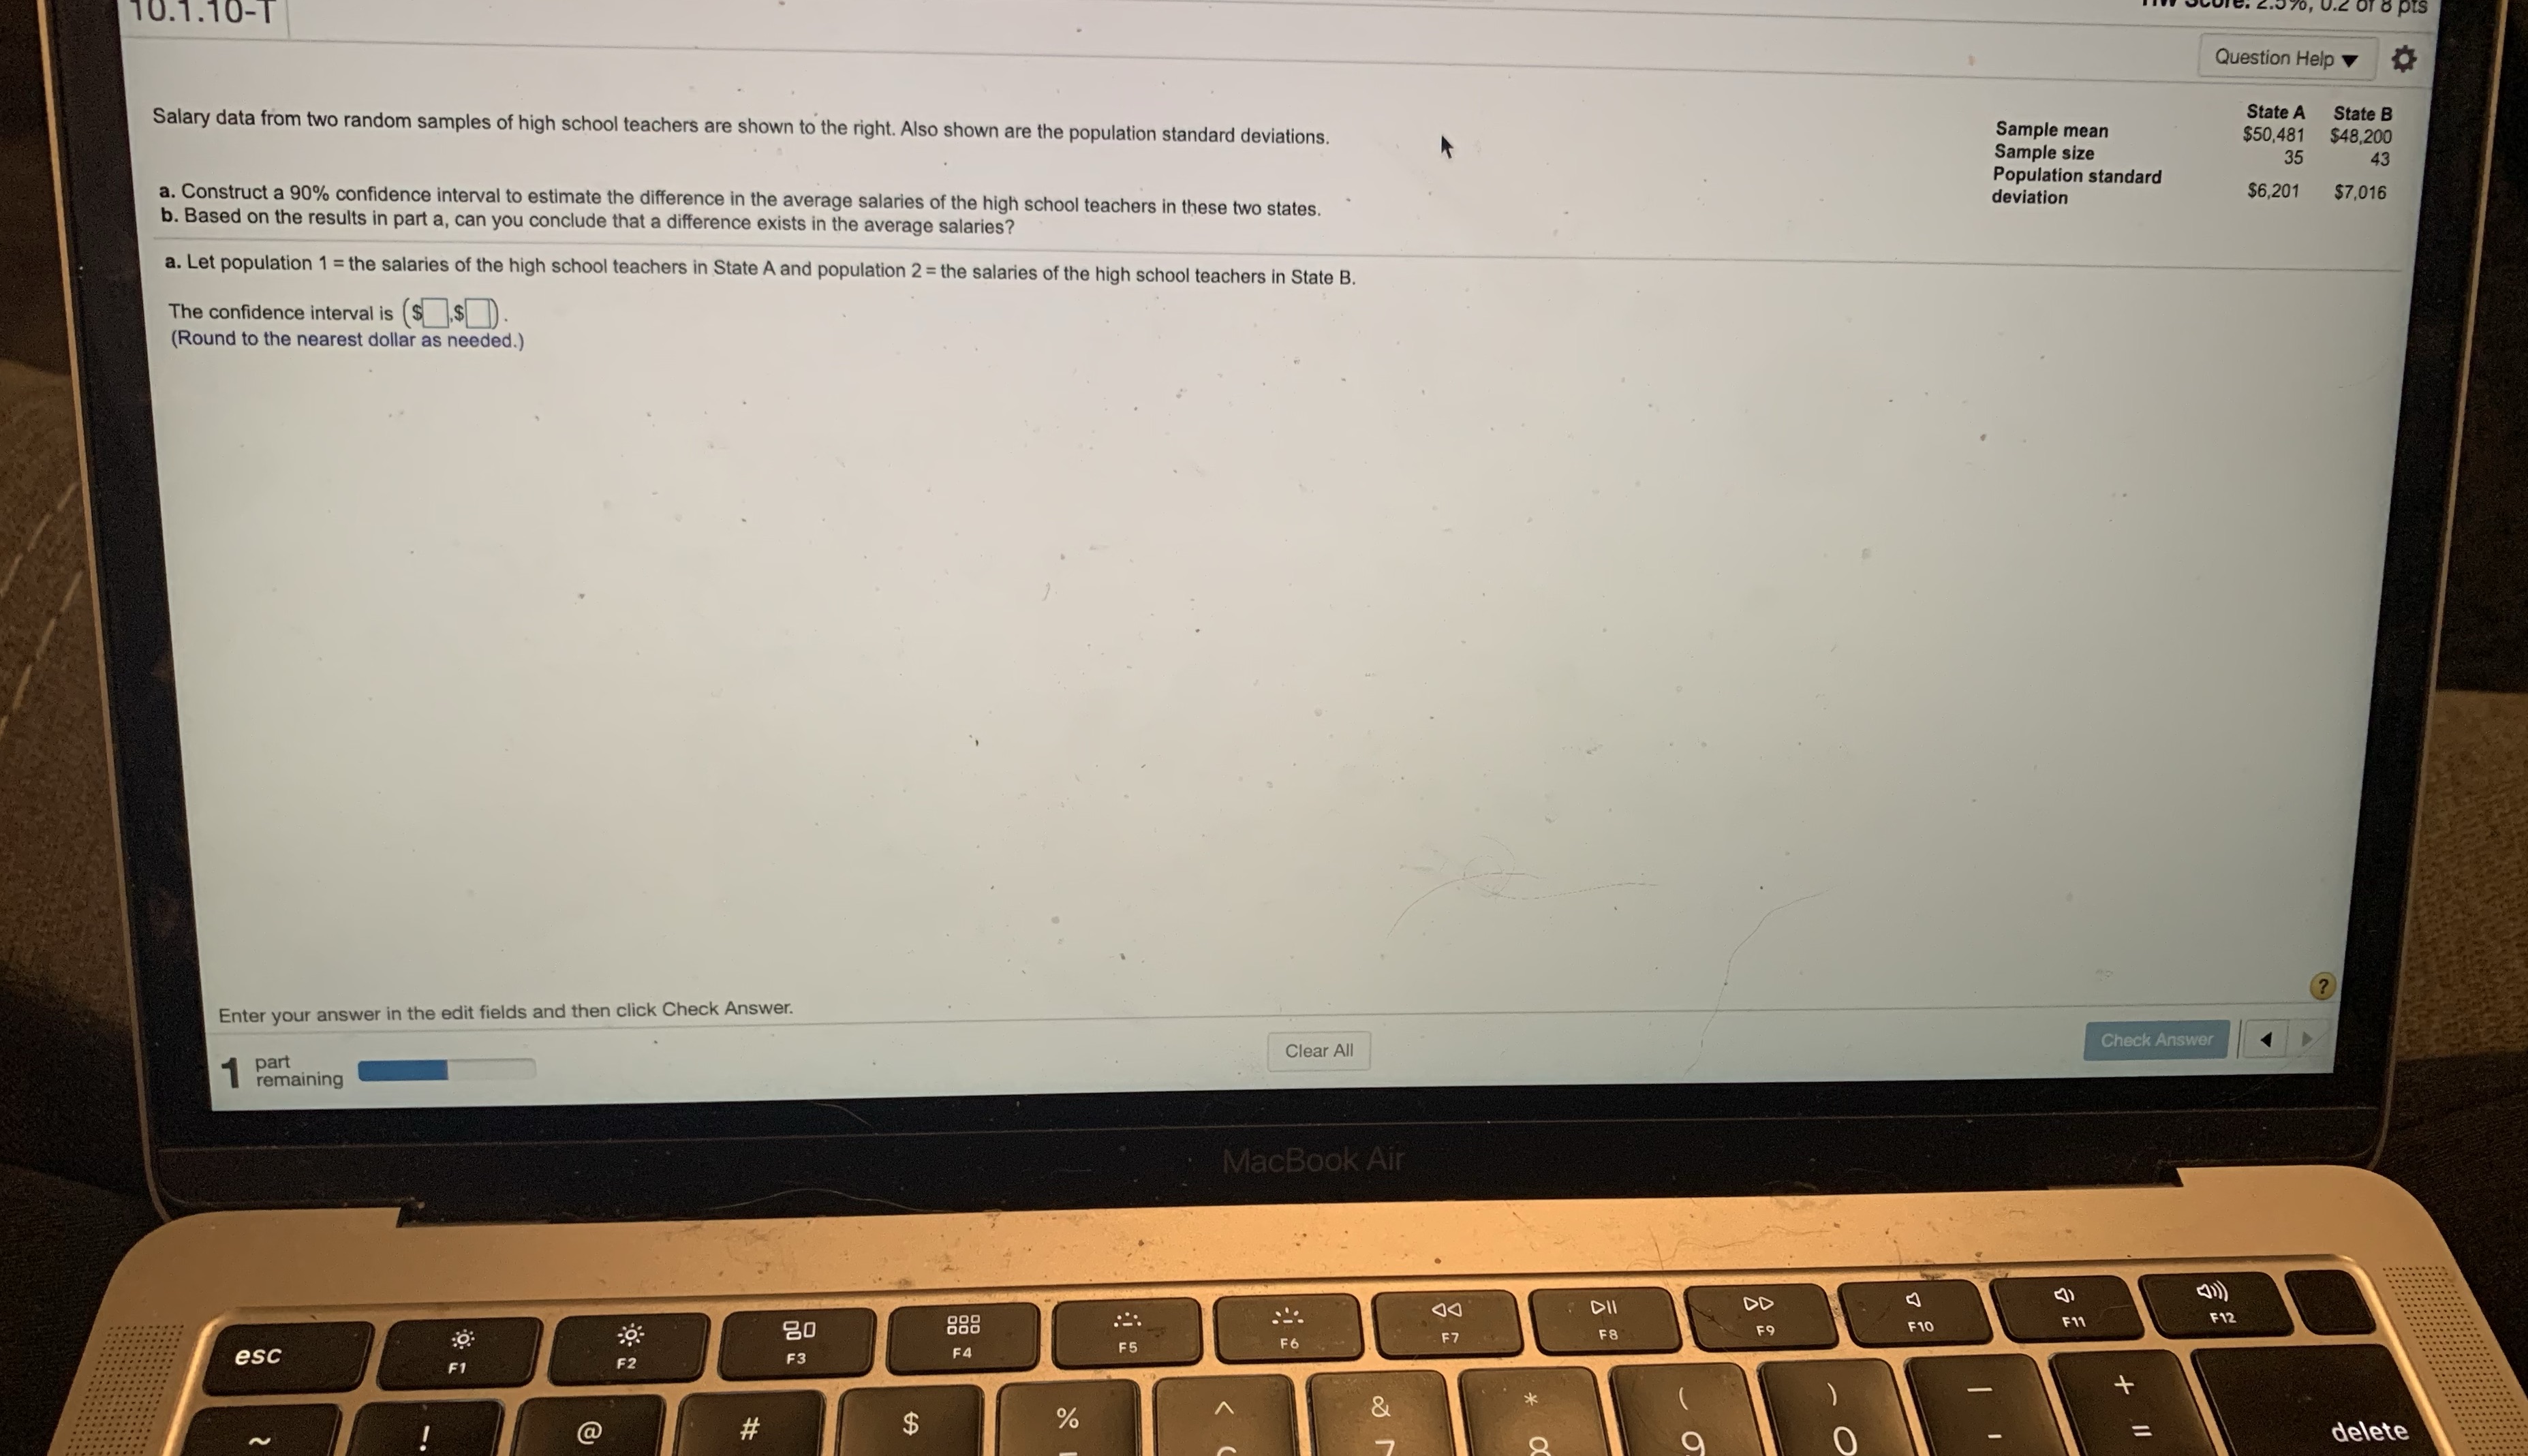
10.1.10-1 Question Help State A State B Sample mean $50,481 $48,200 Salary data from two random samples of high school teachers are shown to the right. Also shown are the population standard deviations. Sample size 35 43 Population standard deviation $6,201 $7,016 a. Construct a 90% confidence interval to estimate the difference in the average salaries of the high school teachers in these two states. b. Based on the results in part a, can you conclude that a difference exists in the average salaries? a. Let population 1 = the salaries of the high school teachers in State A and population 2 = the salaries of the high school teachers in State B. The confidence interval is ($ $ (Round to the nearest dollar as needed.) (? Enter your answer in the edit fields and then click Check Answer. Check Answer Clear All part remaining MacBook Air DII DD F11 F12 F9 F10 20 988 F8 F6 F7 F3 F4 F 5 esc F1 & % delete @ #
Step by Step Solution
There are 3 Steps involved in it

Get step-by-step solutions from verified subject matter experts