

Question: [10*2- 20] Answer the following question 3. Complete the table using the information provided, and Plot the AFC, AC, MC on the chart on the
![[10*2- 20] Answer the following question 3. Complete the table using](https://s3.amazonaws.com/si.experts.images/answers/2024/06/66762469cac53_60166762469948d1.jpg)
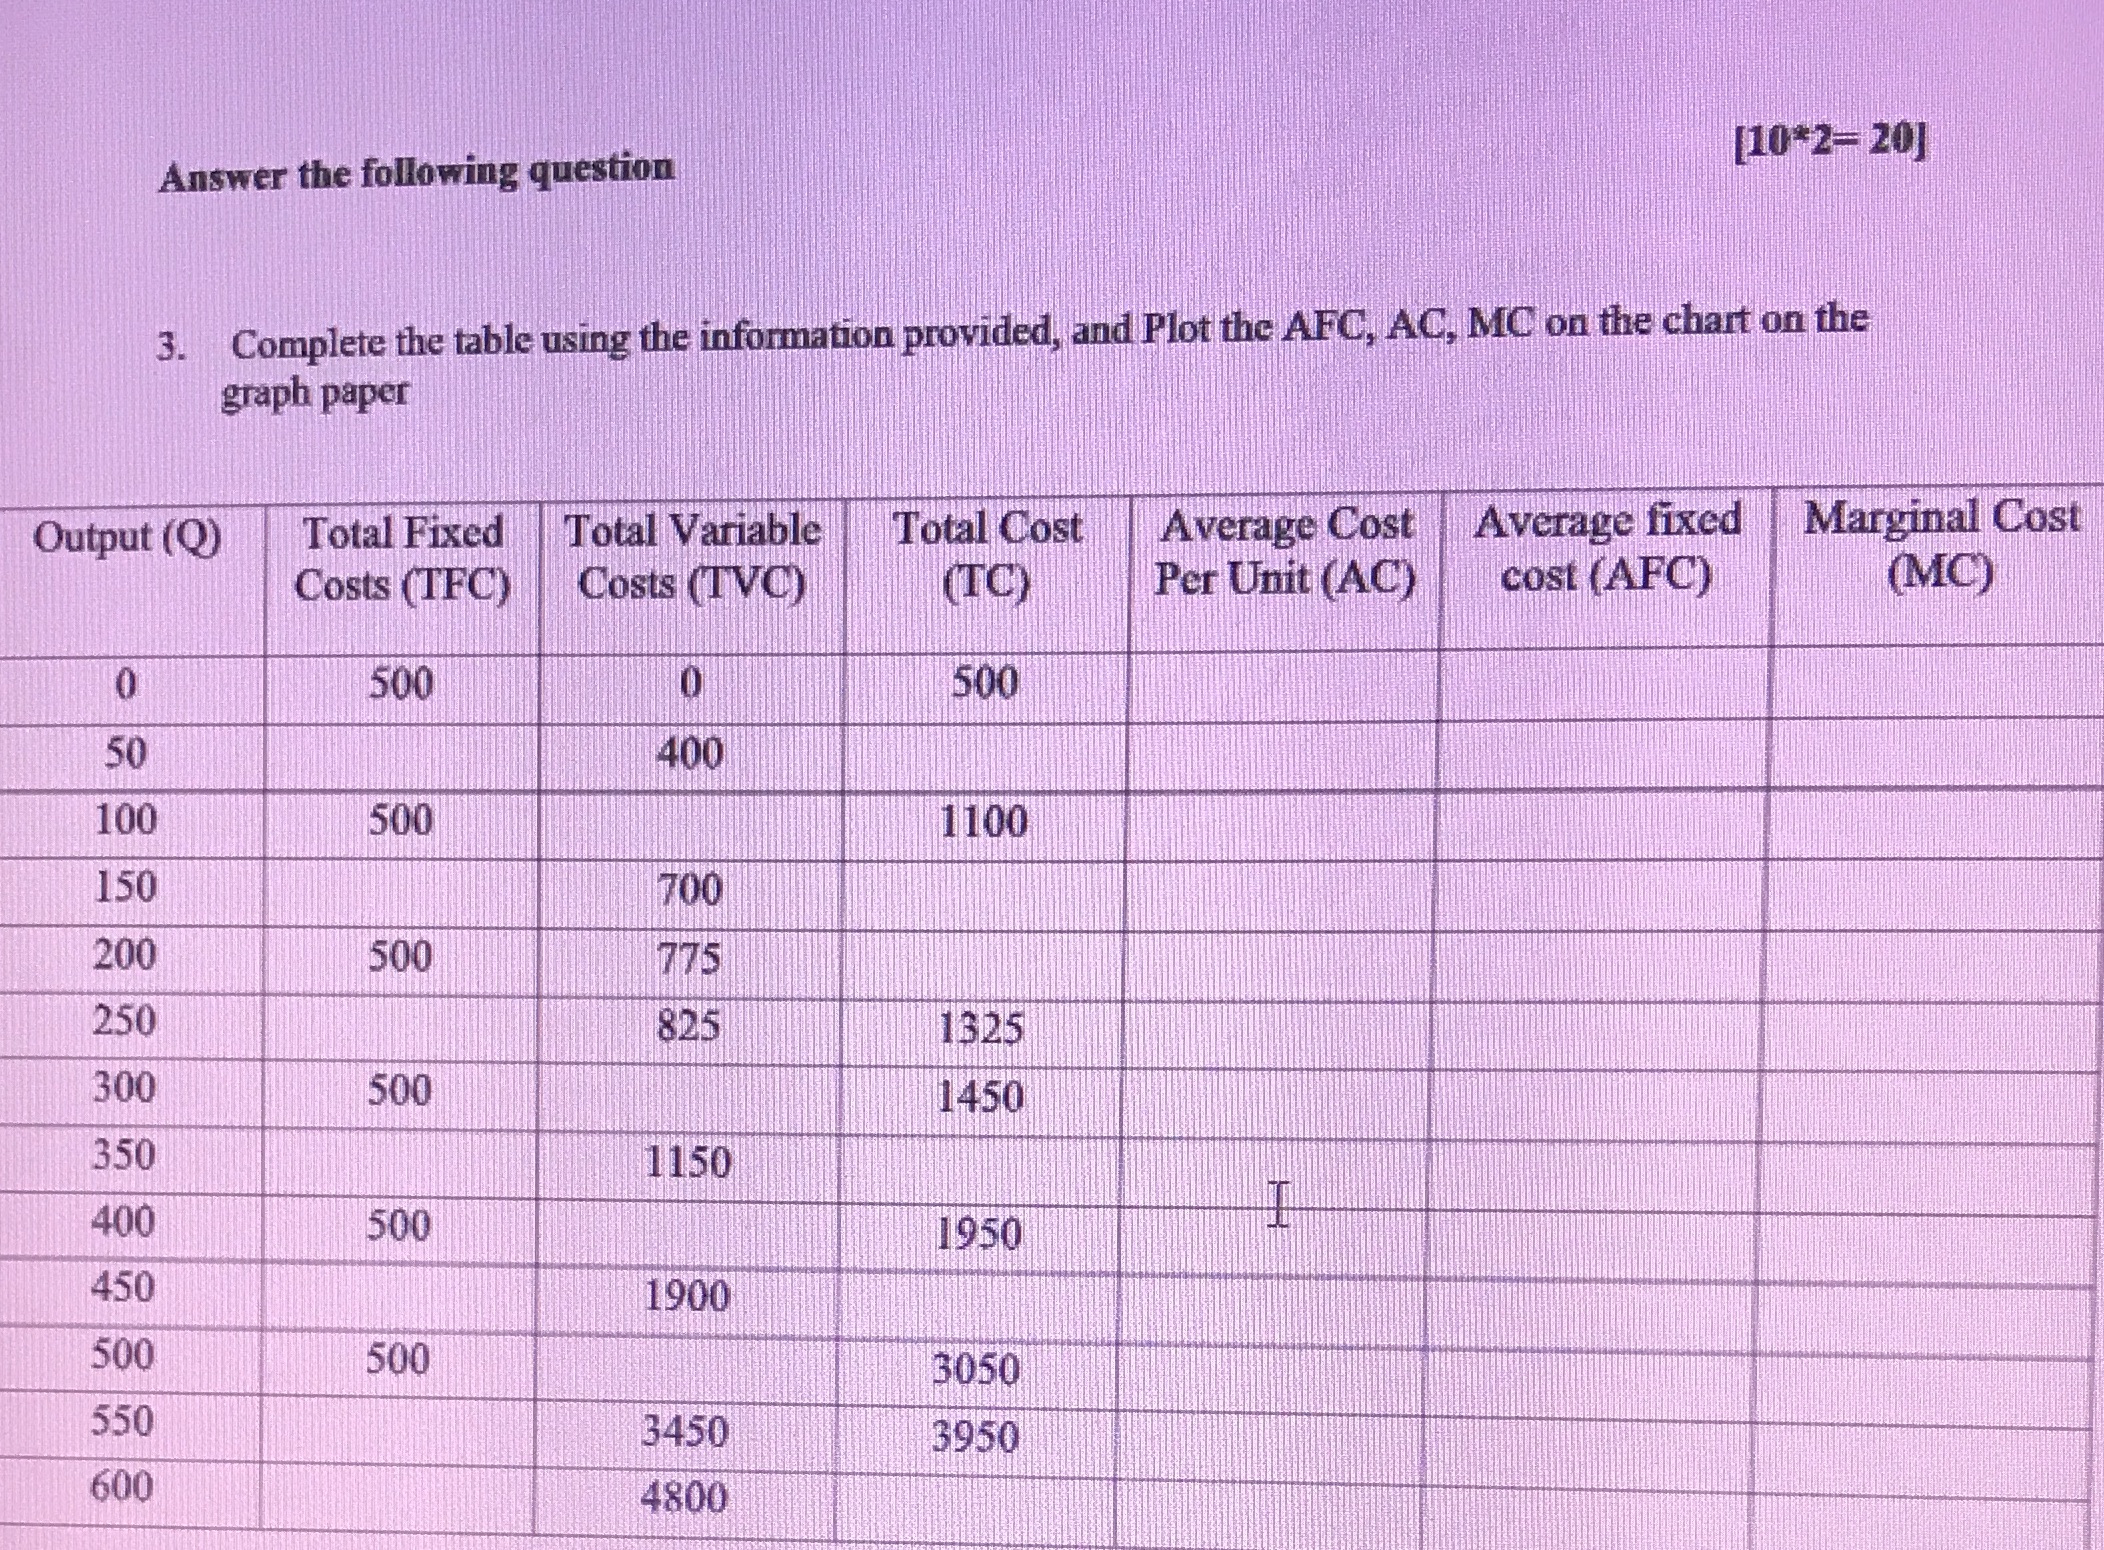
[10*2- 20] Answer the following question 3. Complete the table using the information provided, and Plot the AFC, AC, MC on the chart on the graph paper Output (Q) Total Fixed Total Variable Total Cost Average Cost Average fixed Marginal Cost Costs (TFC) Costs (TVC) (TC) Per Unit (AC) Cost (AFC) (MC) 0 500 500 50 400 100 500 1100 150 700 200 500 775 250 825 1325 300 500 1450 350 1150 400 500 1950 450 1900 500 500 3050 550 3450 3950 600 4800
Step by Step Solution
There are 3 Steps involved in it
1 Expert Approved Answer
Step: 1 Unlock

Question Has Been Solved by an Expert!
Get step-by-step solutions from verified subject matter experts
Step: 2 Unlock
Step: 3 Unlock