

Question: 10.2: Hypothesis Test for a Population Proportion 1. True or false: If false, explain. a. If the P-value = 0.03, then the null hypothesis is
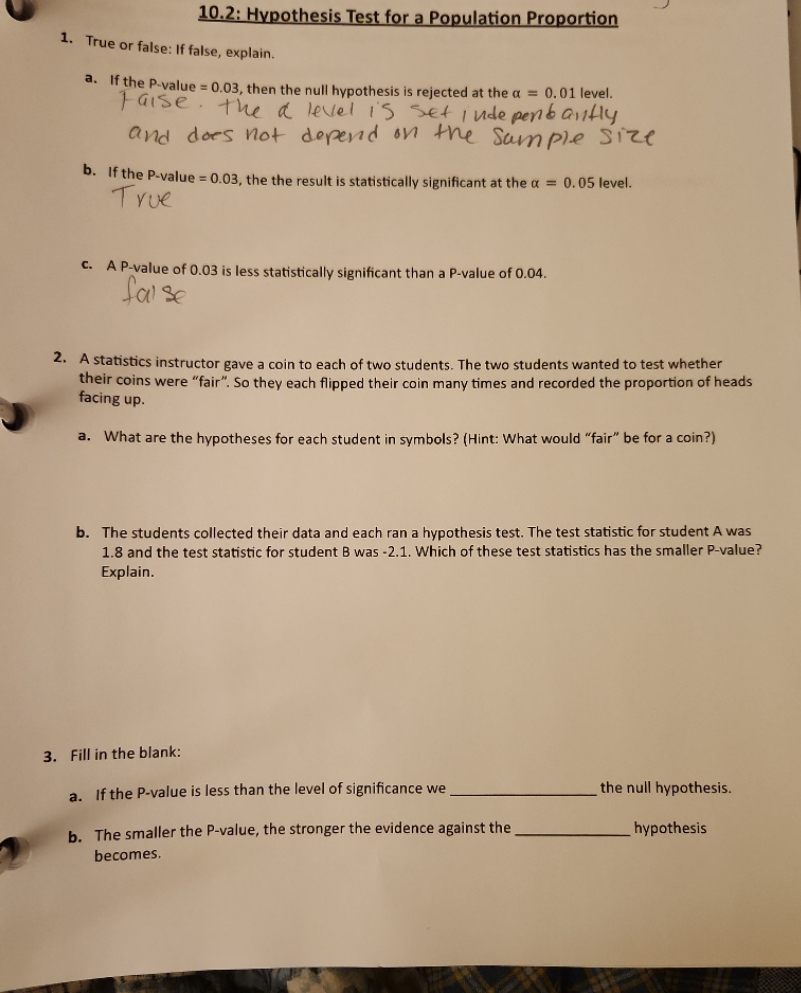
10.2: Hypothesis Test for a Population Proportion 1. True or false: If false, explain. a. If the P-value = 0.03, then the null hypothesis is rejected at the a = 0. 01 level. False. the a level is set independantly and does not depend on the sample size b. If the P-value = 0.03, the the result is statistically significant at the a = 0.05 level. True C. A P-value of 0.03 is less statistically significant than a P-value of 0.04. false 2. A statistics instructor gave a coin to each of two students. The two students wanted to test whether their coins were "fair". So they each flipped their coin many times and recorded the proportion of heads facing up. a. What are the hypotheses for each student in symbols? (Hint: What would "fair" be for a coin?) b. The students collected their data and each ran a hypothesis test. The test statistic for student A was 1.8 and the test statistic for student B was -2.1. Which of these test statistics has the smaller P-value? Explain. 3. Fill in the blank: a. If the P-value is less than the level of significance we the null hypothesis. b. The smaller the P-value, the stronger the evidence against the hypothesis becomes
Step by Step Solution
There are 3 Steps involved in it

Get step-by-step solutions from verified subject matter experts