

Question: 10.20 (a) Compute the trend by semi-average method. Also find 6- yearly average moving (centred) and plot the original and trend values on a graph
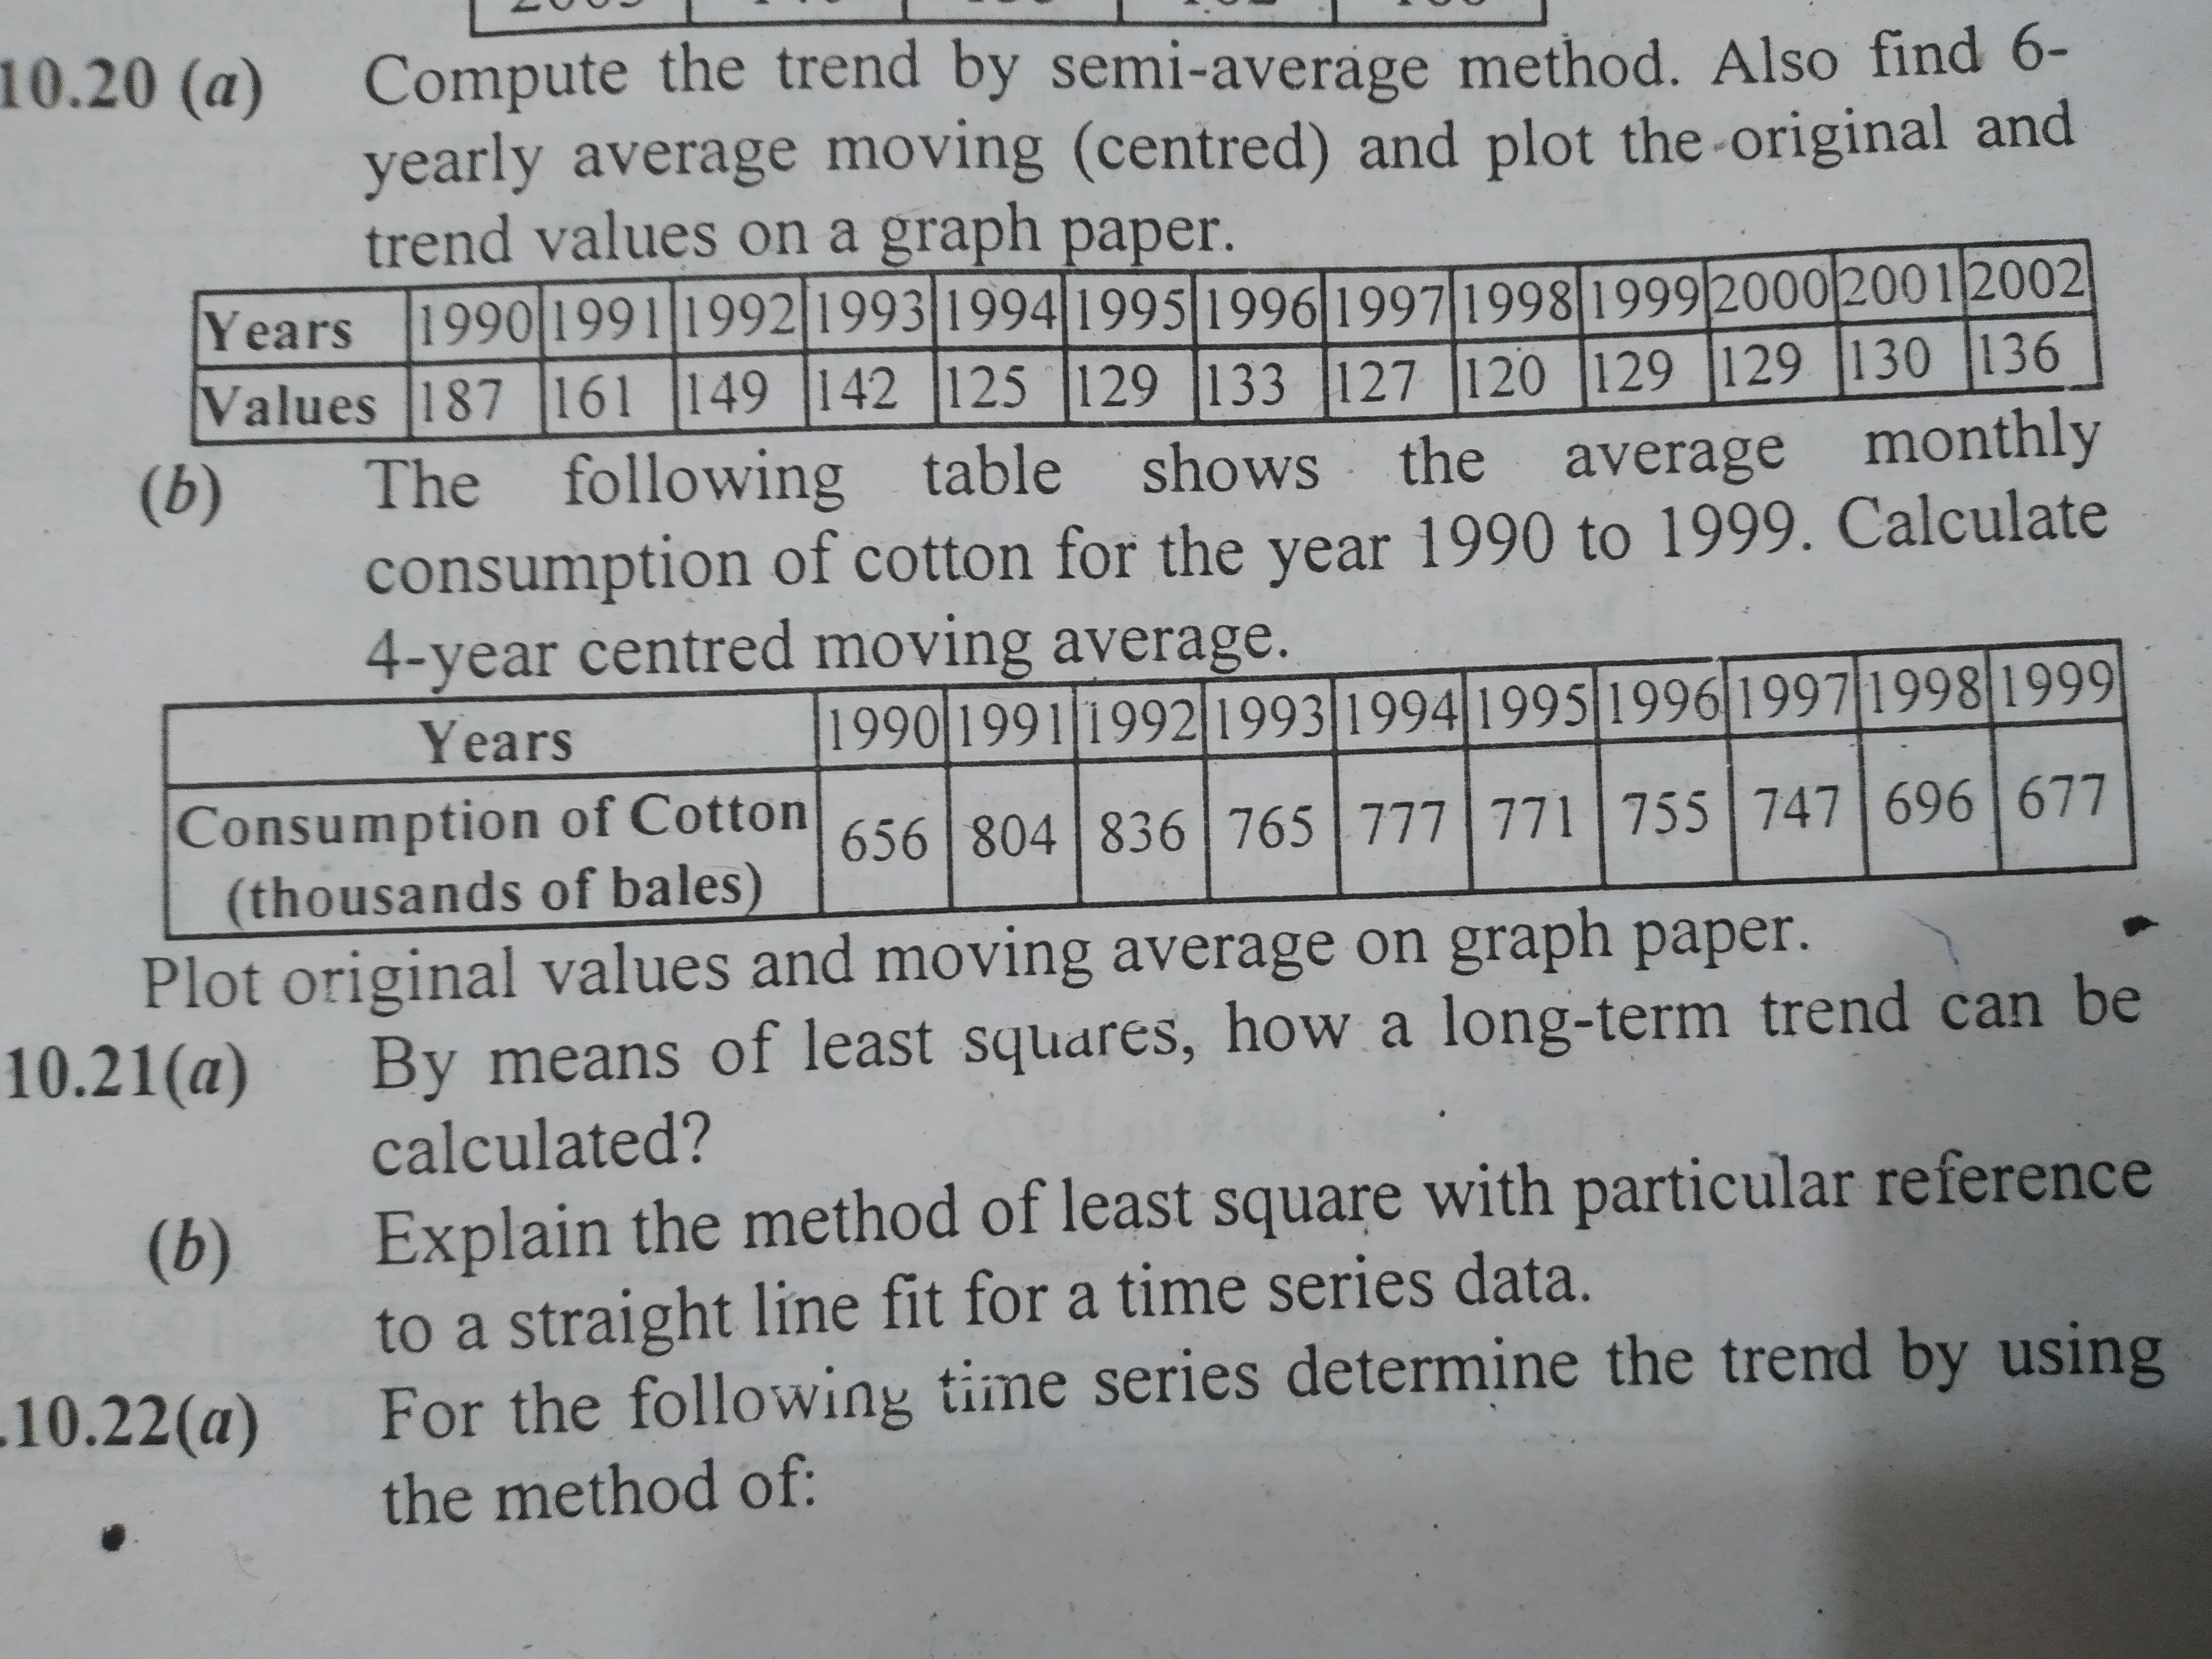
10.20 (a) Compute the trend by semi-average method. Also find 6- yearly average moving (centred) and plot the original and trend values on a graph paper. Years 1990 1991 1992 1993 1994 1995 1996 1997 1998 1999 2000 2001 2002 Values 187 161 149 142 125 129 133 127 120 129 129 130 136 (b) The following table shows the average monthly consumption of cotton for the year 1990 to 1999. Calculate 4-year centred moving average. Years 1990 1991 1992 1993 1994 1995 1996 1997 1998 1999 Consumption of Cotton 656 804 836 765 777 771 755 747 696 677 (thousands of bales) Plot original values and moving average on graph paper. 10.21(a) By means of least squares, how a long-term trend can be calculated? (b) Explain the method of least square with particular reference to a straight line fit for a time series data. 10.22(a) For the following time series determine the trend by using the method of
Step by Step Solution
There are 3 Steps involved in it

Get step-by-step solutions from verified subject matter experts