

Question: The following table represents the total amount of money, a, in billions of dollars spent on health care in a country in different years,
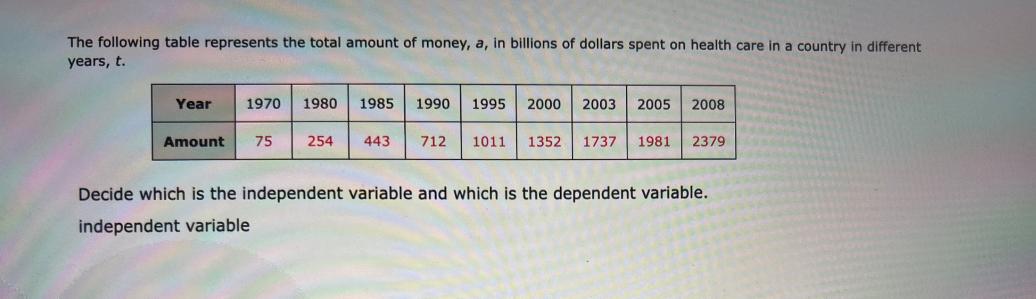
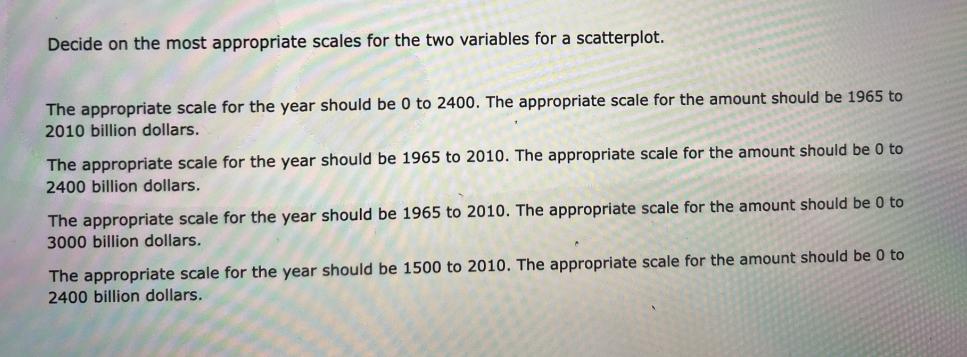
The following table represents the total amount of money, a, in billions of dollars spent on health care in a country in different years, t. Year Amount 1970 1980 1985 1990 1995 2000 2003 2005 2008 443 712 1011 1352 1737 1981 2379 75 254 Decide which is the independent variable and which is the dependent variable. independent variable Decide on the most appropriate scales for the two variables for a scatterplot. The appropriate scale for the year should be 0 to 2400. The appropriate scale for the amount should be 1965 to 2010 billion dollars. The appropriate scale for the year should be 1965 to 2010. The appropriate scale for the amount should be 0 to 2400 billion dollars. The appropriate scale for the year should be 1965 to 2010. The appropriate scale for the amount should be 0 to 3000 billion dollars. The appropriate scale for the year should be 1500 to 2010. The appropriate scale for the amount should be 0 to 2400 billion dollars.
Step by Step Solution
3.53 Rating (143 Votes )
There are 3 Steps involved in it
In this scenario the independent variable is the year t ... View full answer

Get step-by-step solutions from verified subject matter experts