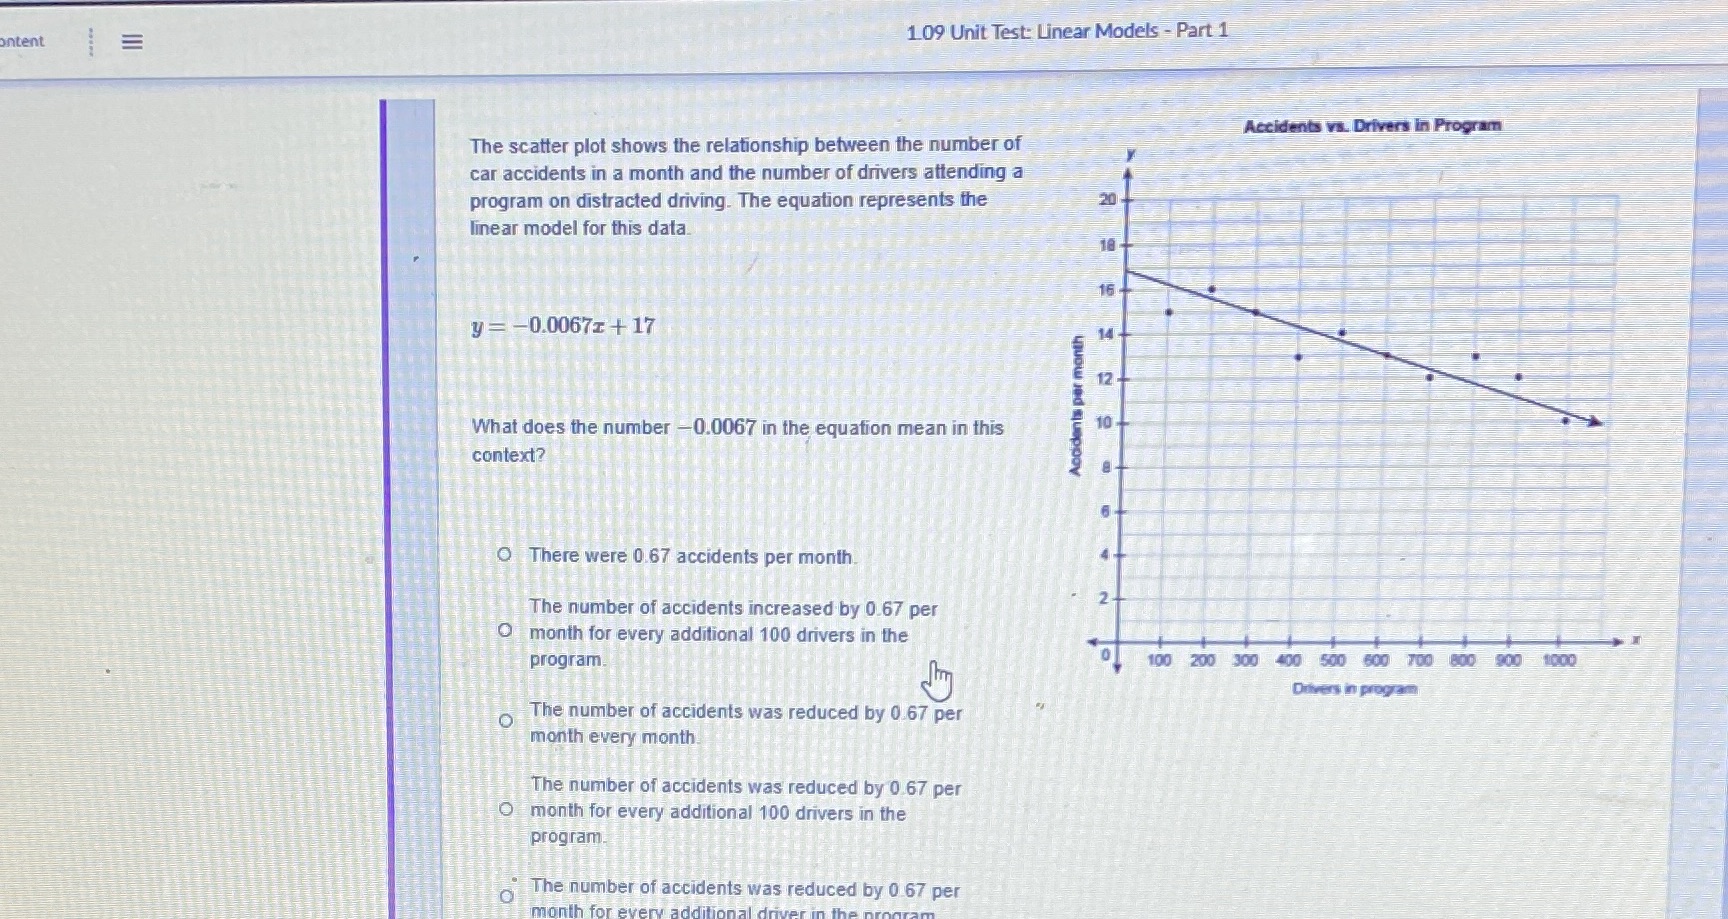
Question: 109 Unit Test: Linear Models - Part 1 ontent Accidents vs. Drivers in Program The scatter plot shows the relationship between the number of car

109 Unit Test: Linear Models - Part 1 ontent
109 Unit Test: Linear Models - Part 1 ontent Accidents vs. Drivers in Program The scatter plot shows the relationship between the number of car accidents in a month and the number of drivers attending a program on distracted driving. The equation represents the 20 linear model for this data. 16 y = -0.0067z + 17 14 12 Accidents per month What does the number -0.0067 in the equation mean in this 10 context? O There were 0.67 accidents per month The number of accidents increased by 0.67 per month for every additional 100 drivers in the program. 100 200 300 400 500 600 700 800 900 1000 Drivers in program The number of accidents was reduced by 0.67 per month every month. The number of accidents was reduced by 0 67 per O month for every additional 100 drivers in the program. The number of accidents was reduced by 0 67 per month for every additions

Step by Step Solution

There are 3 Steps involved in it

1 Expert Approved Answer
Step: 1 Unlock blur-text-image
Question Has Been Solved by an Expert!

Get step-by-step solutions from verified subject matter experts

Step: 2 Unlock
Step: 3 Unlock

Students Have Also Explored These Related Mathematics Questions!