

Question: 11. 1 2 3 4 5 6 7 8 9 10 G) 12 13 Alcohol withdrawal occurs when a person who uses alcohol excessively suddenly
11.
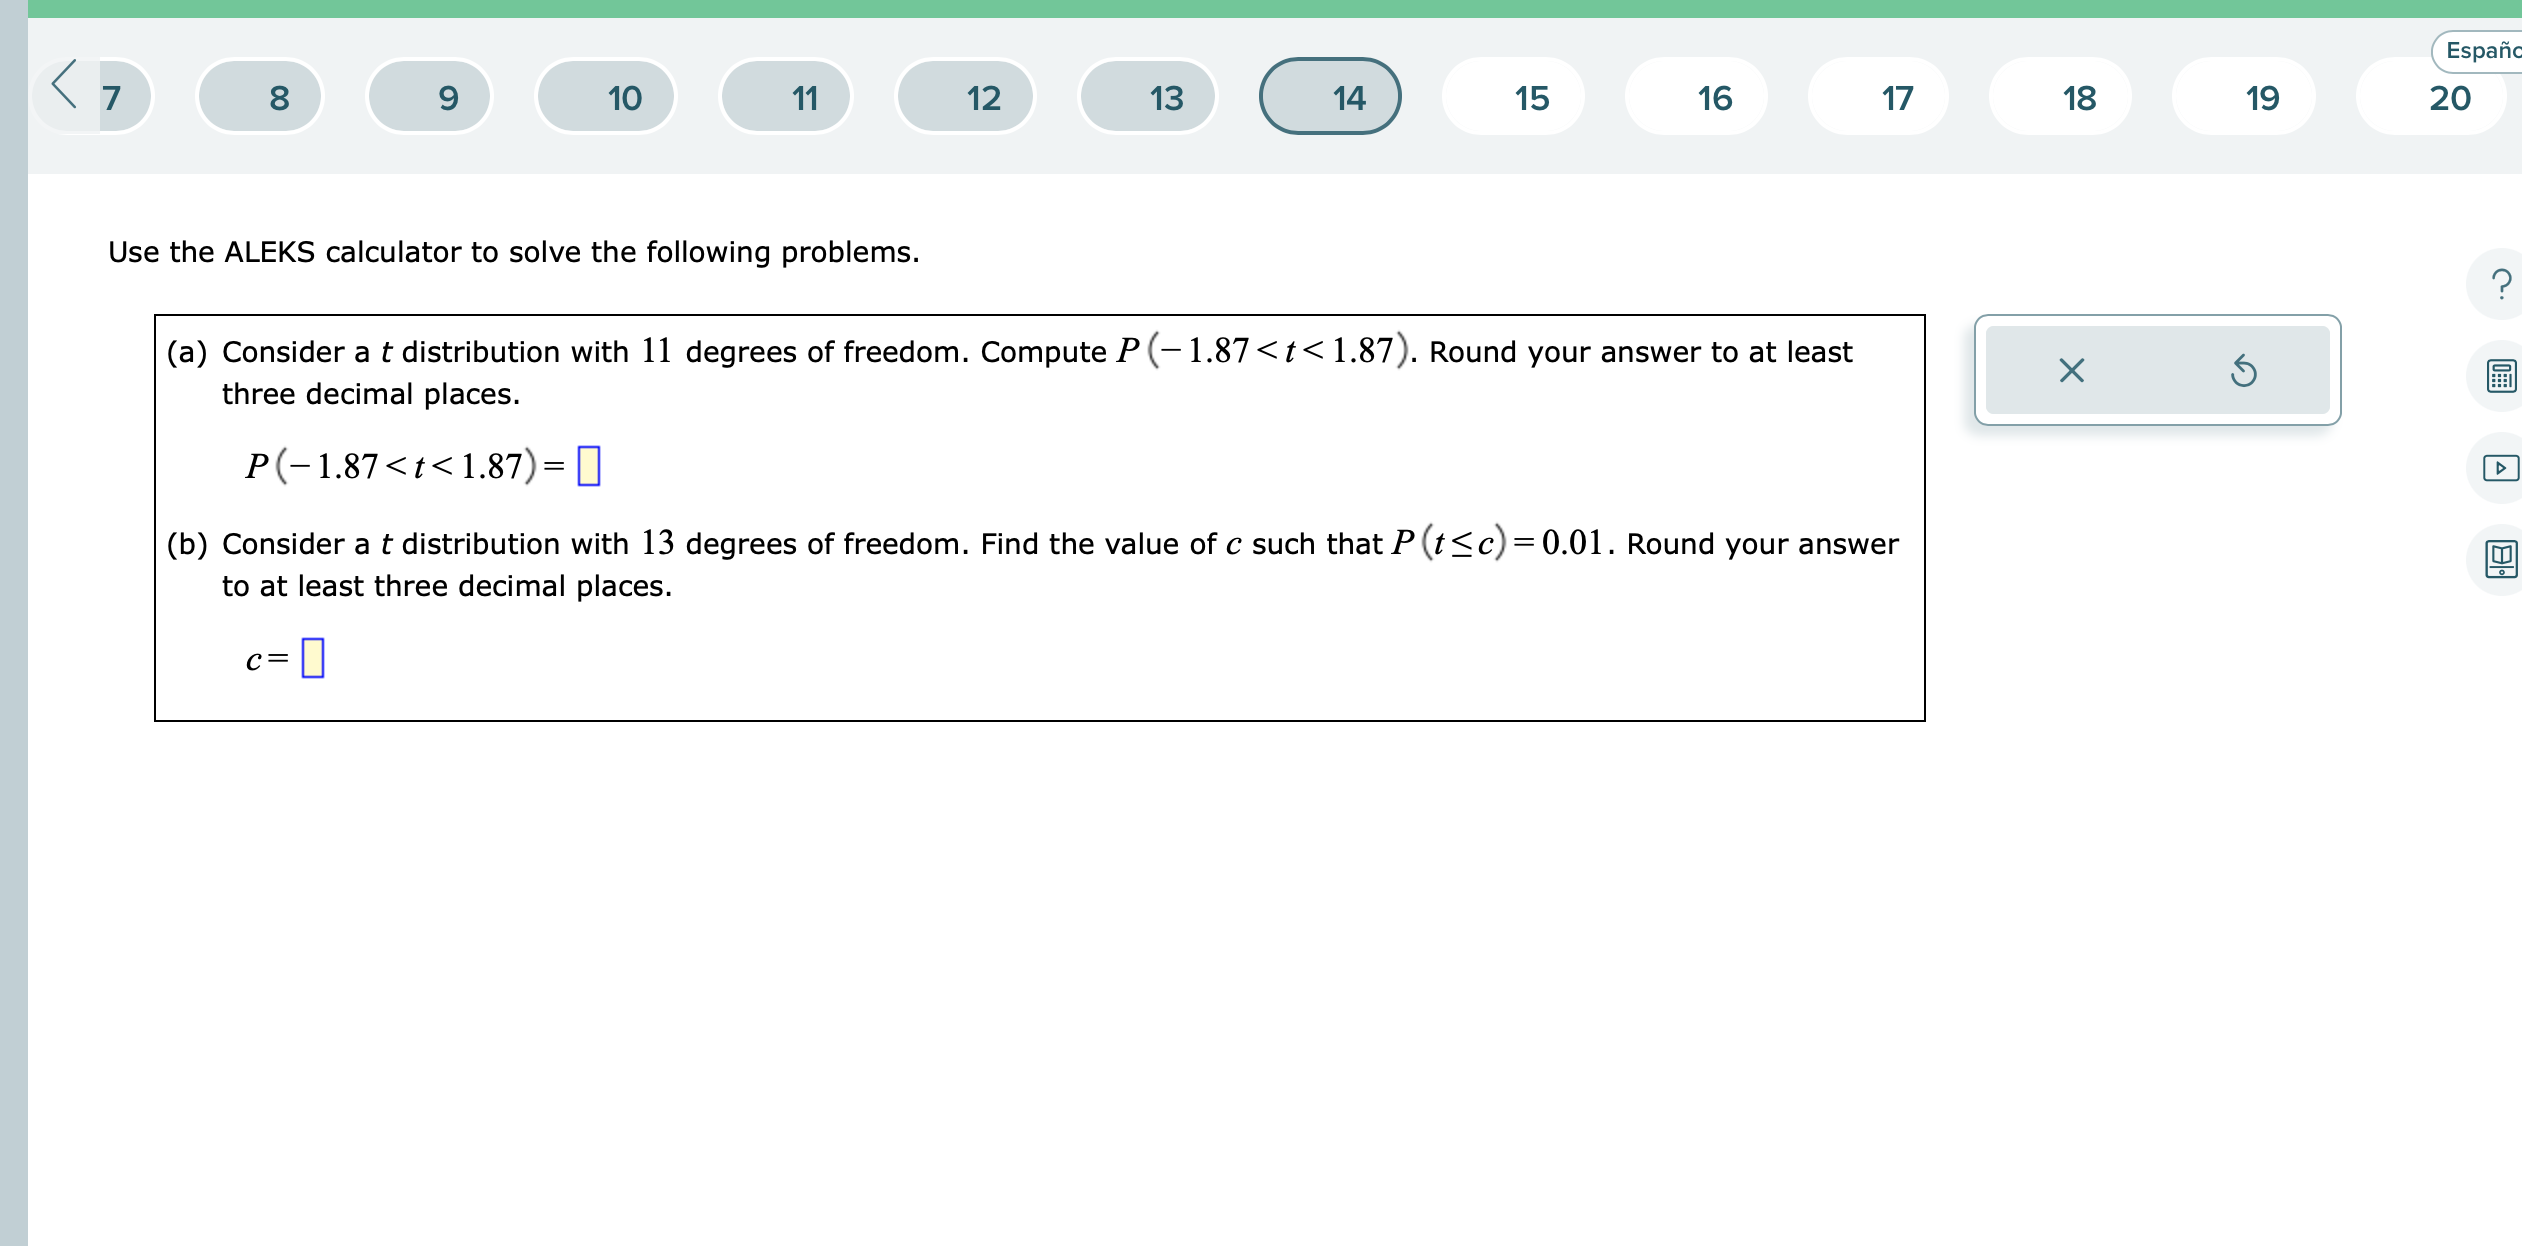
![three decimal places. ] / x s 6.0 5.2 f. x 6.0](https://s3.amazonaws.com/si.experts.images/answers/2024/06/667e9887c55b9_615667e9887a6a9a.jpg)
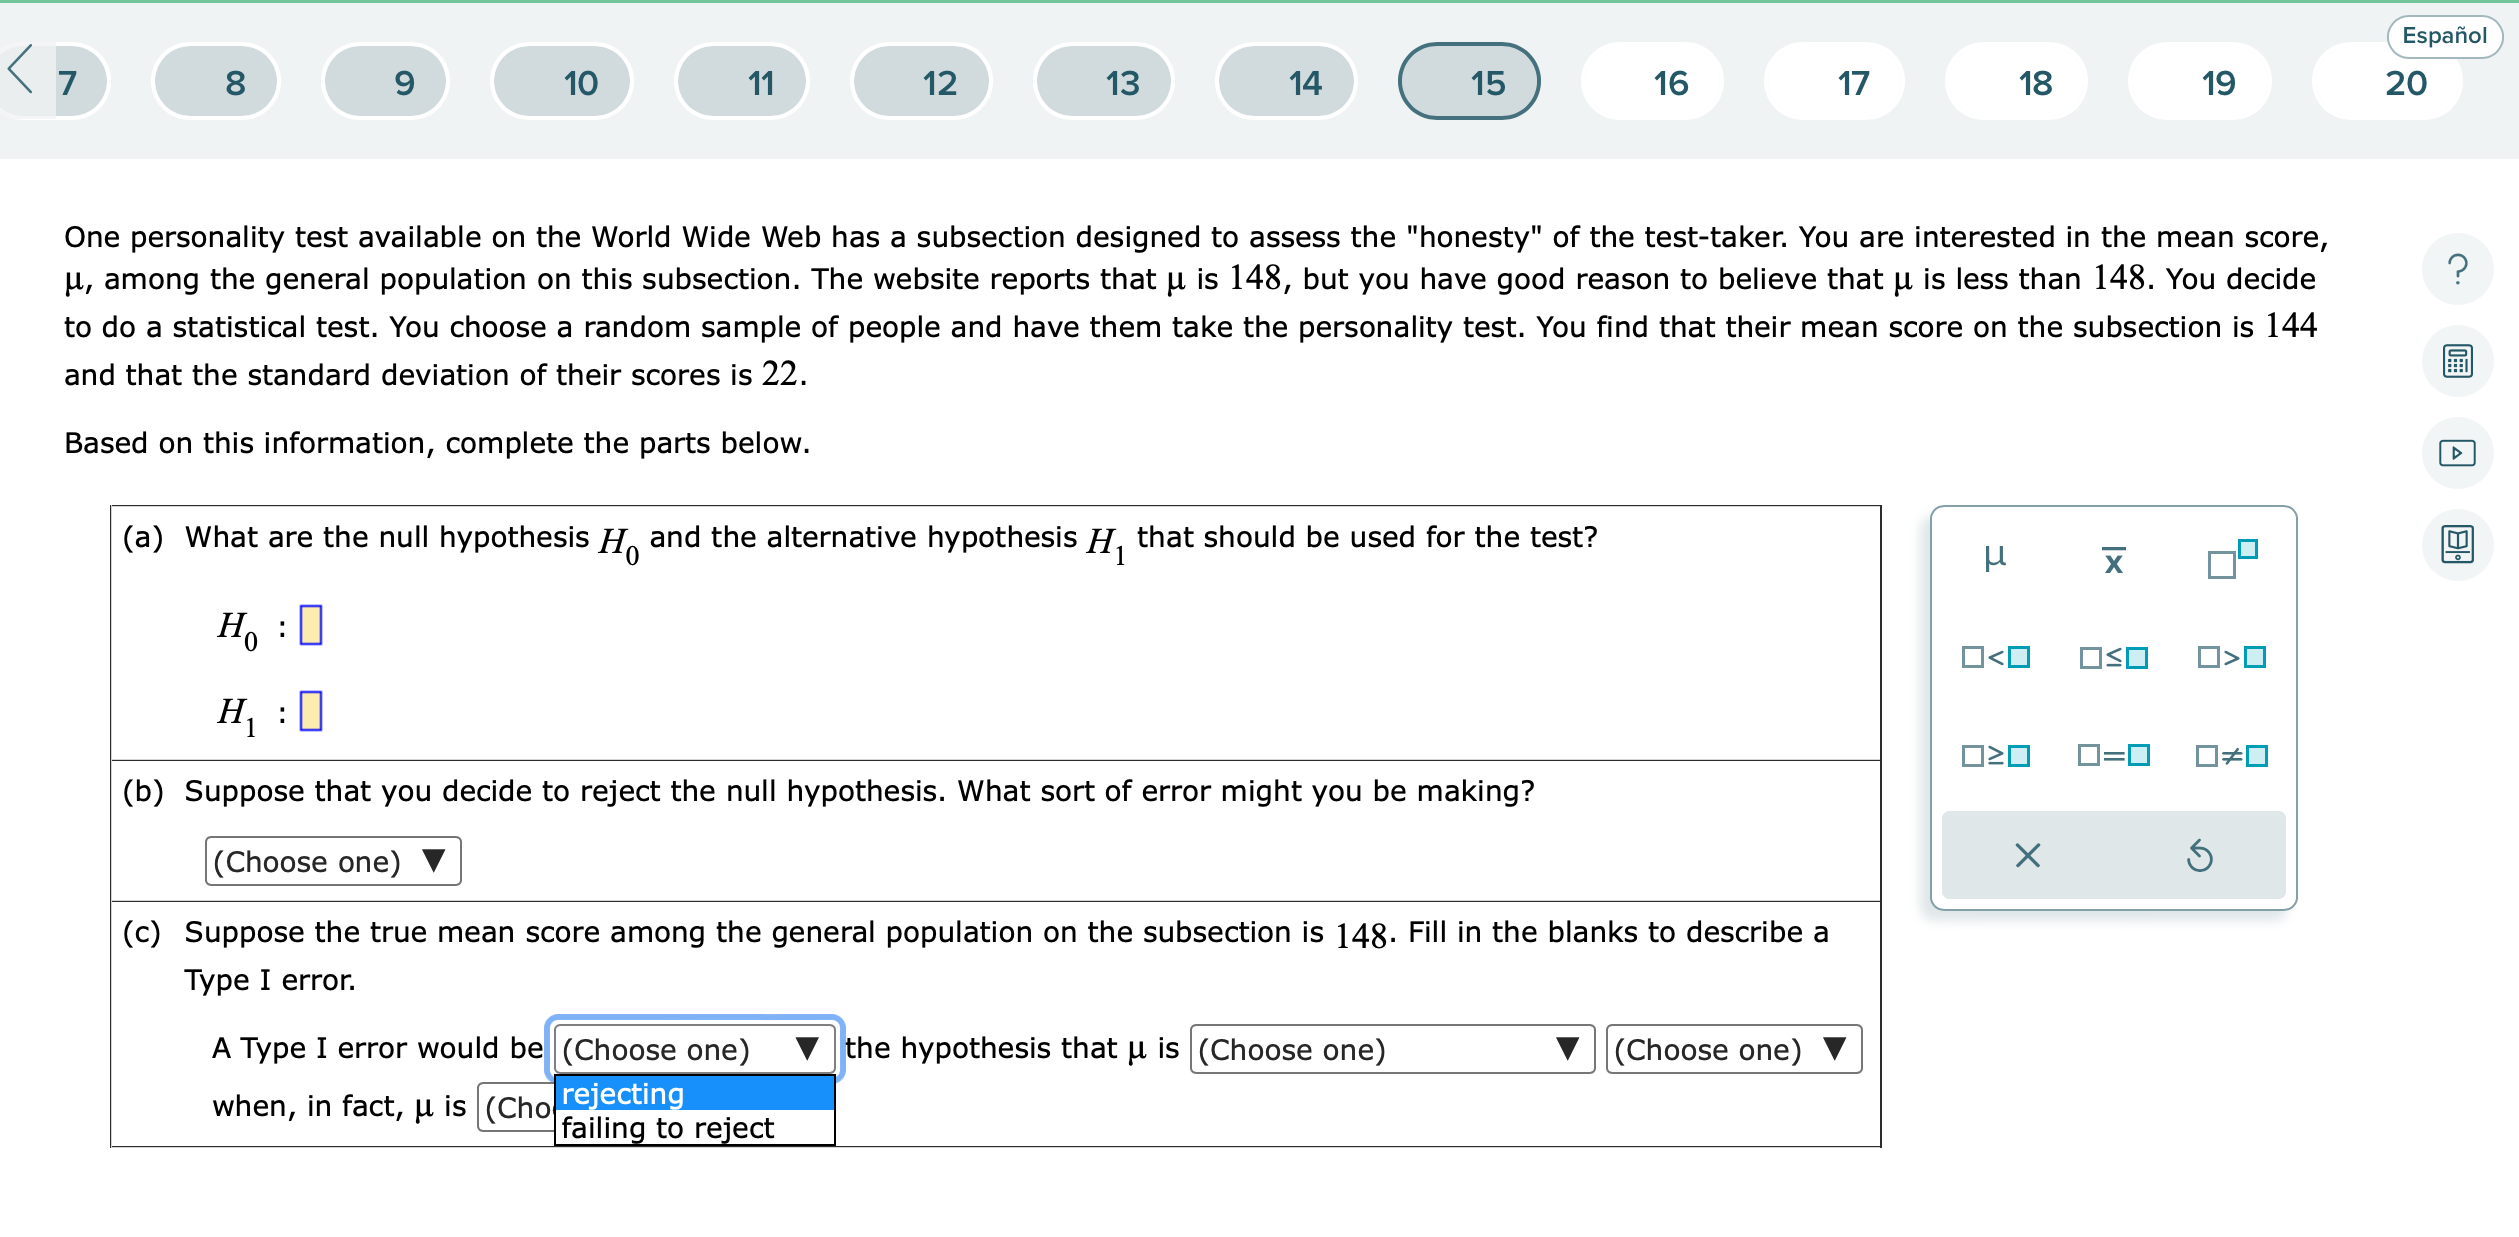
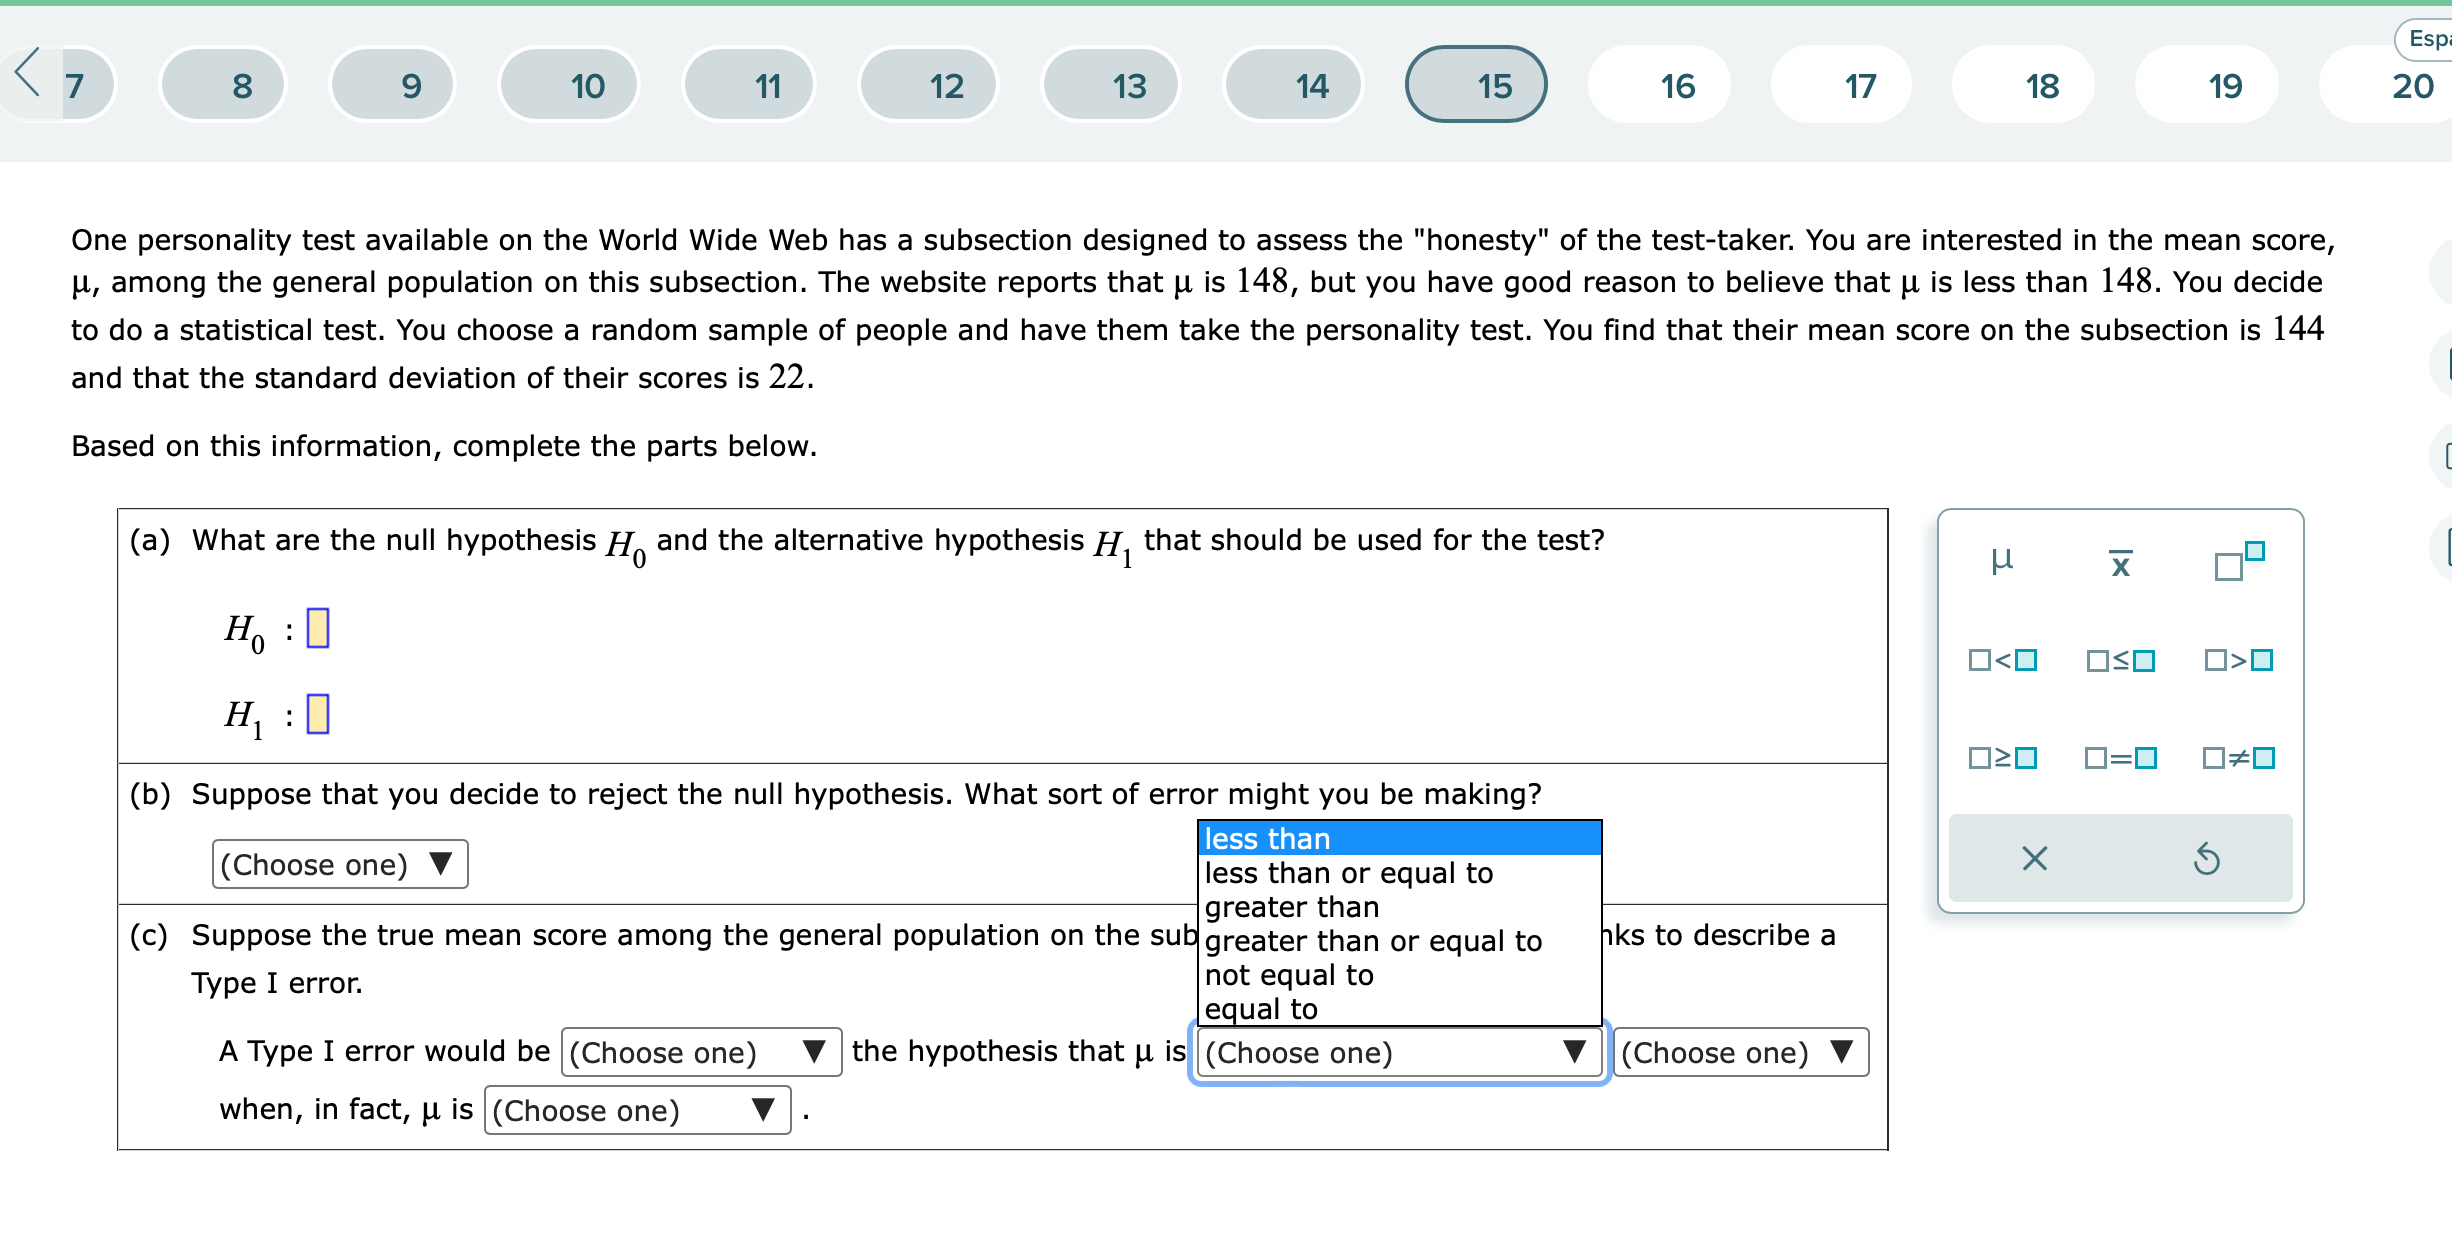
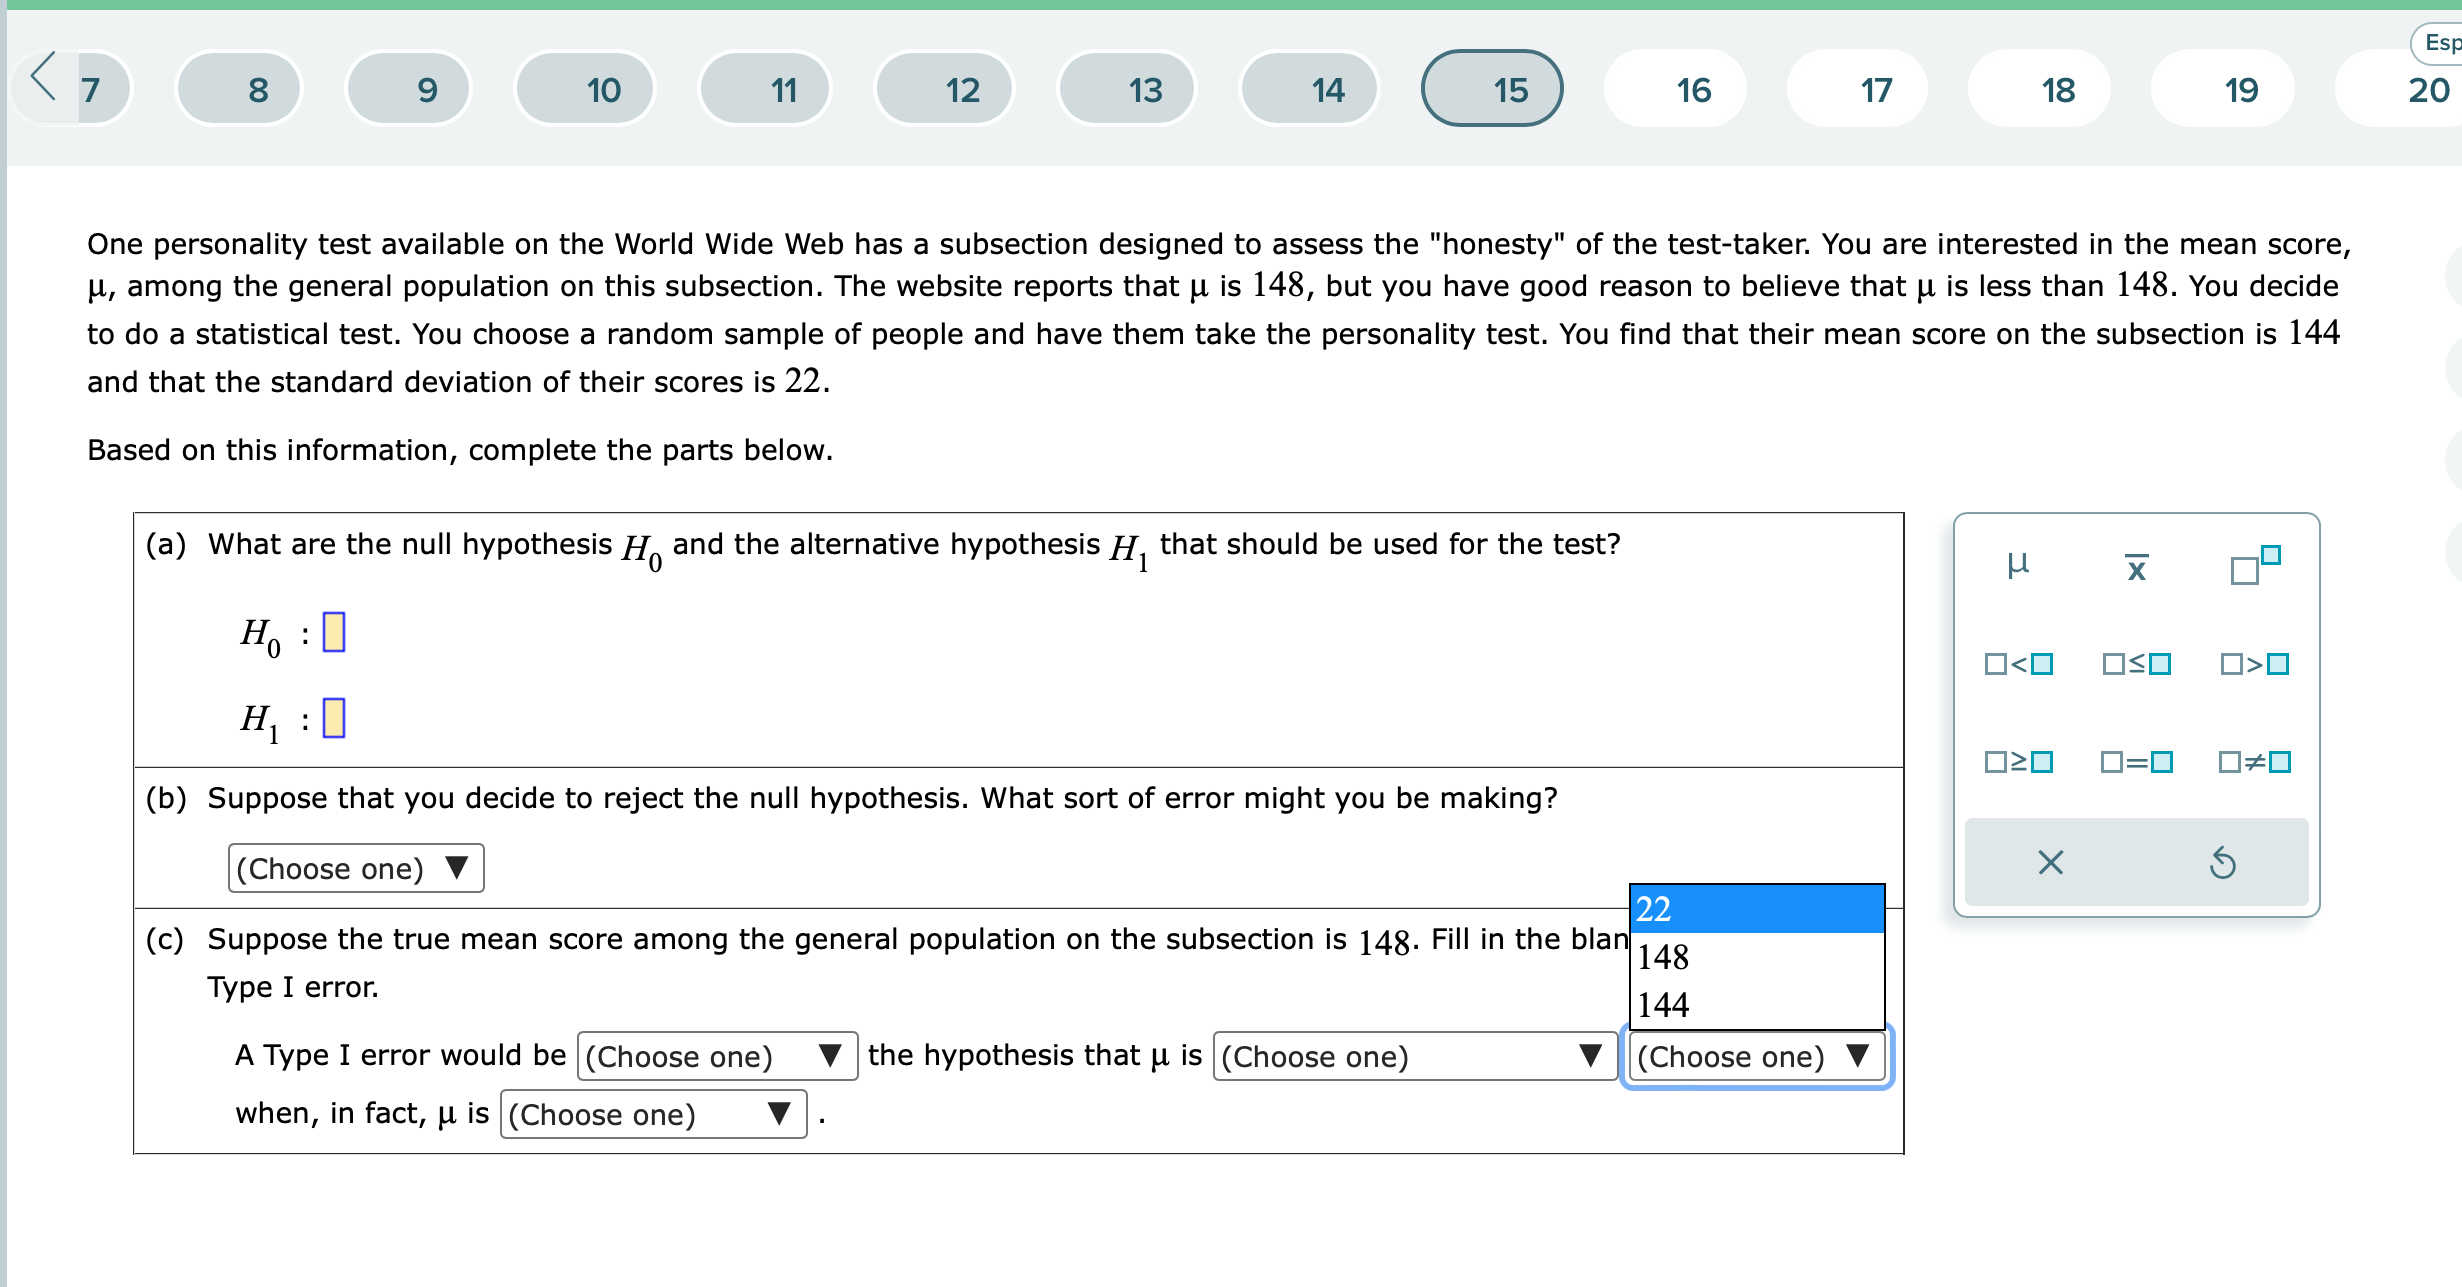
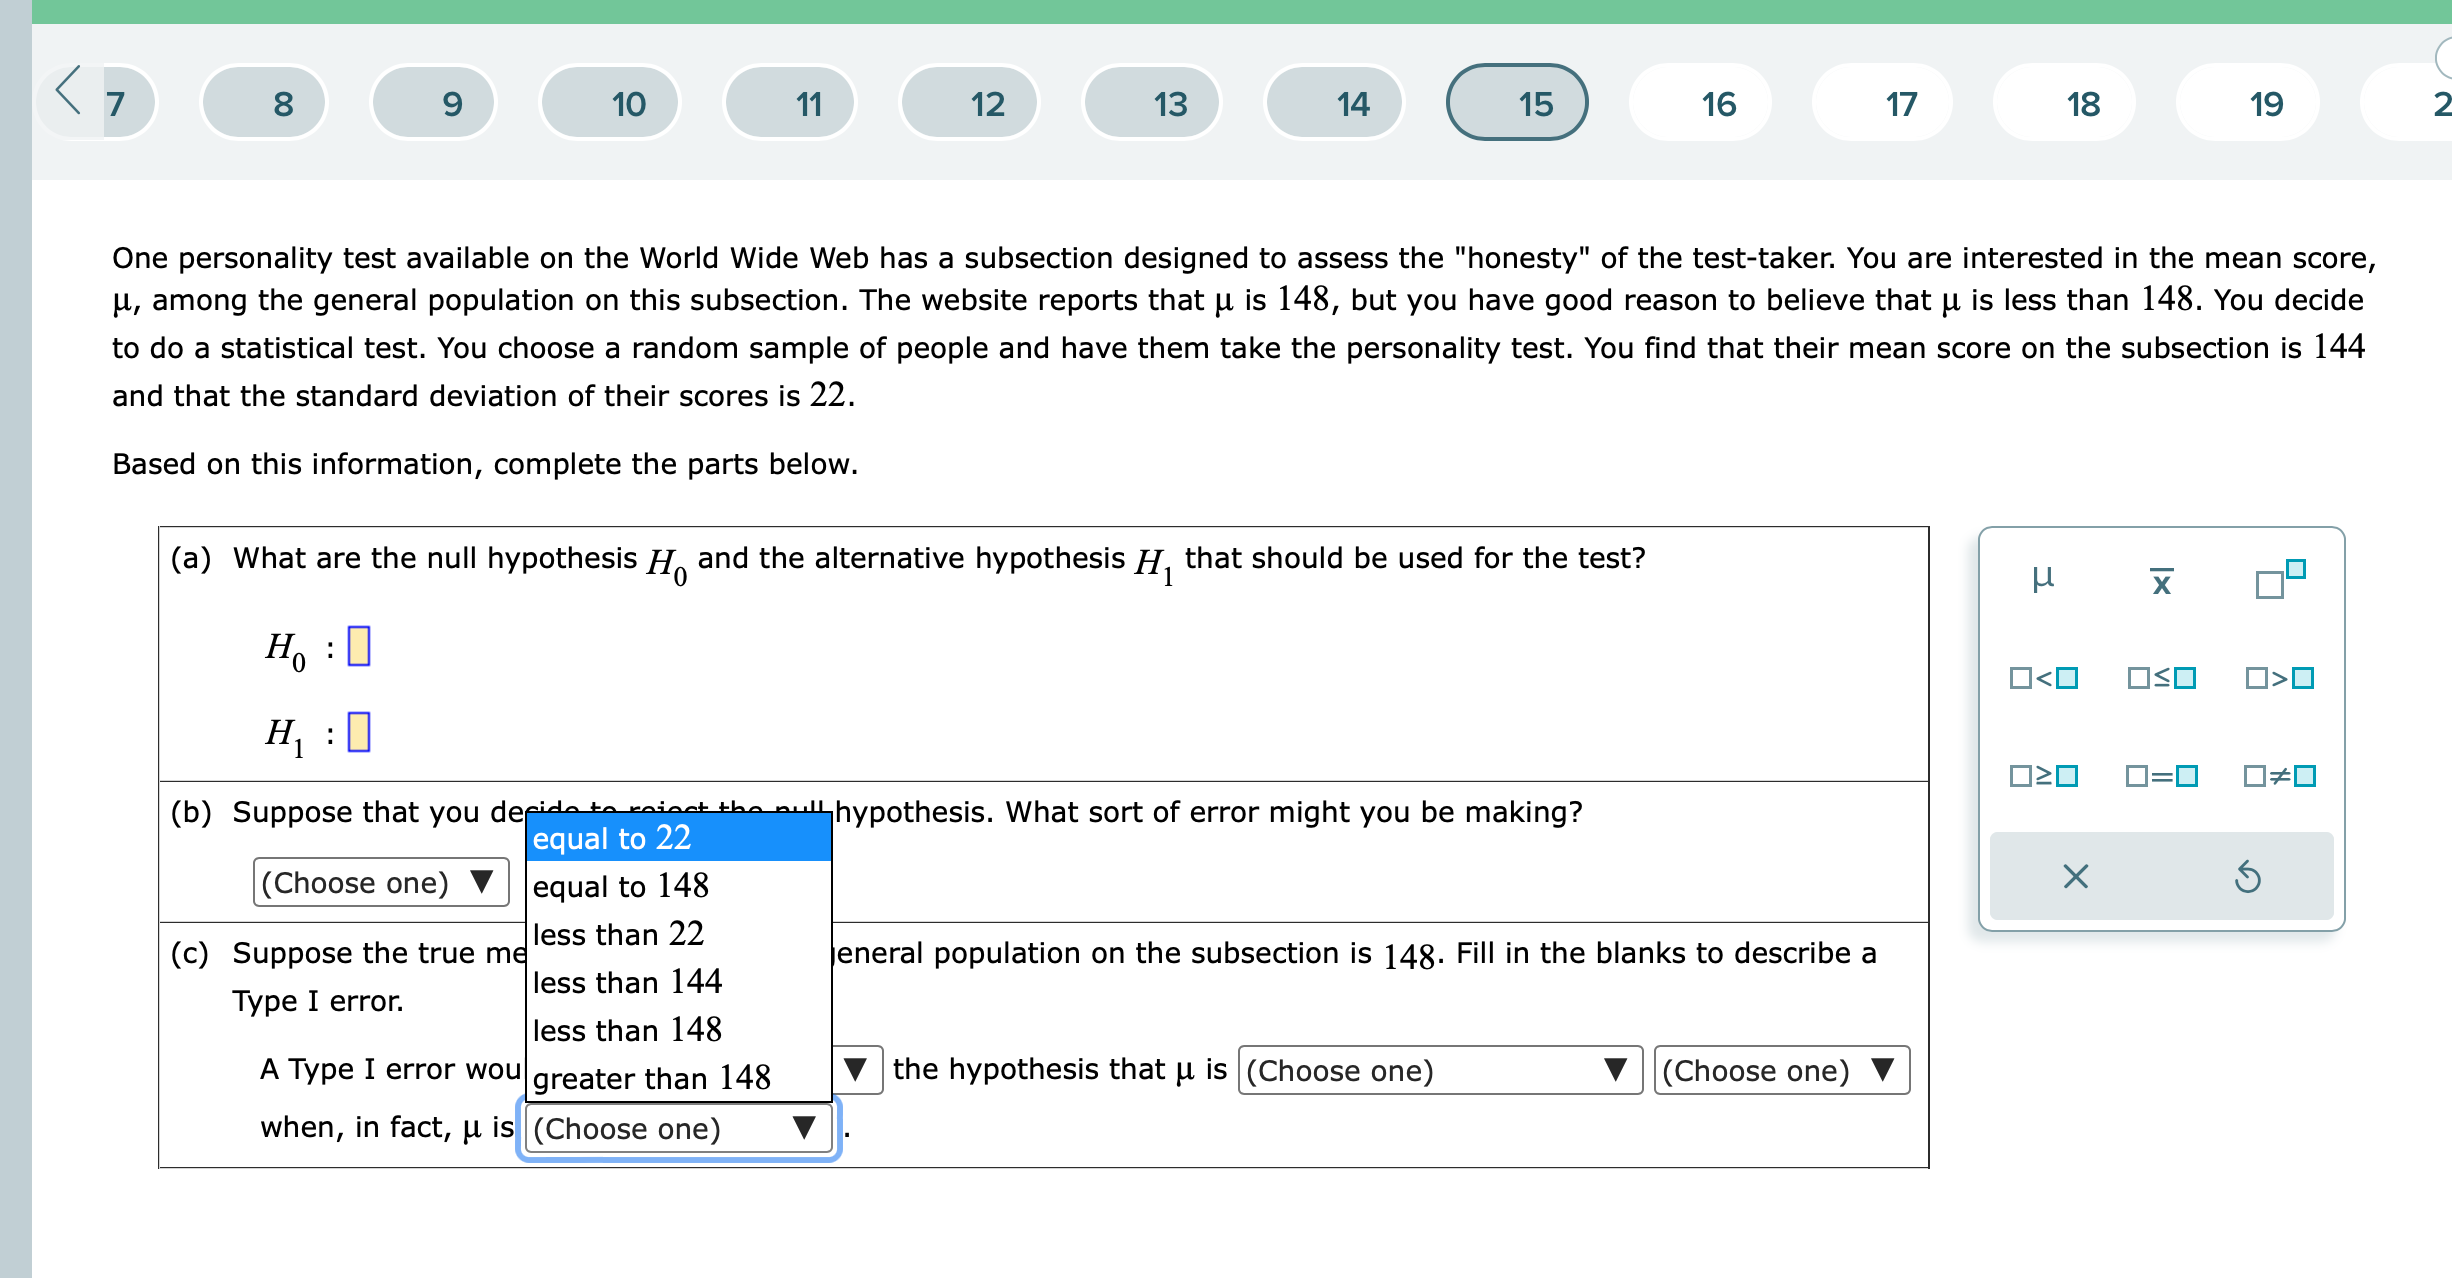
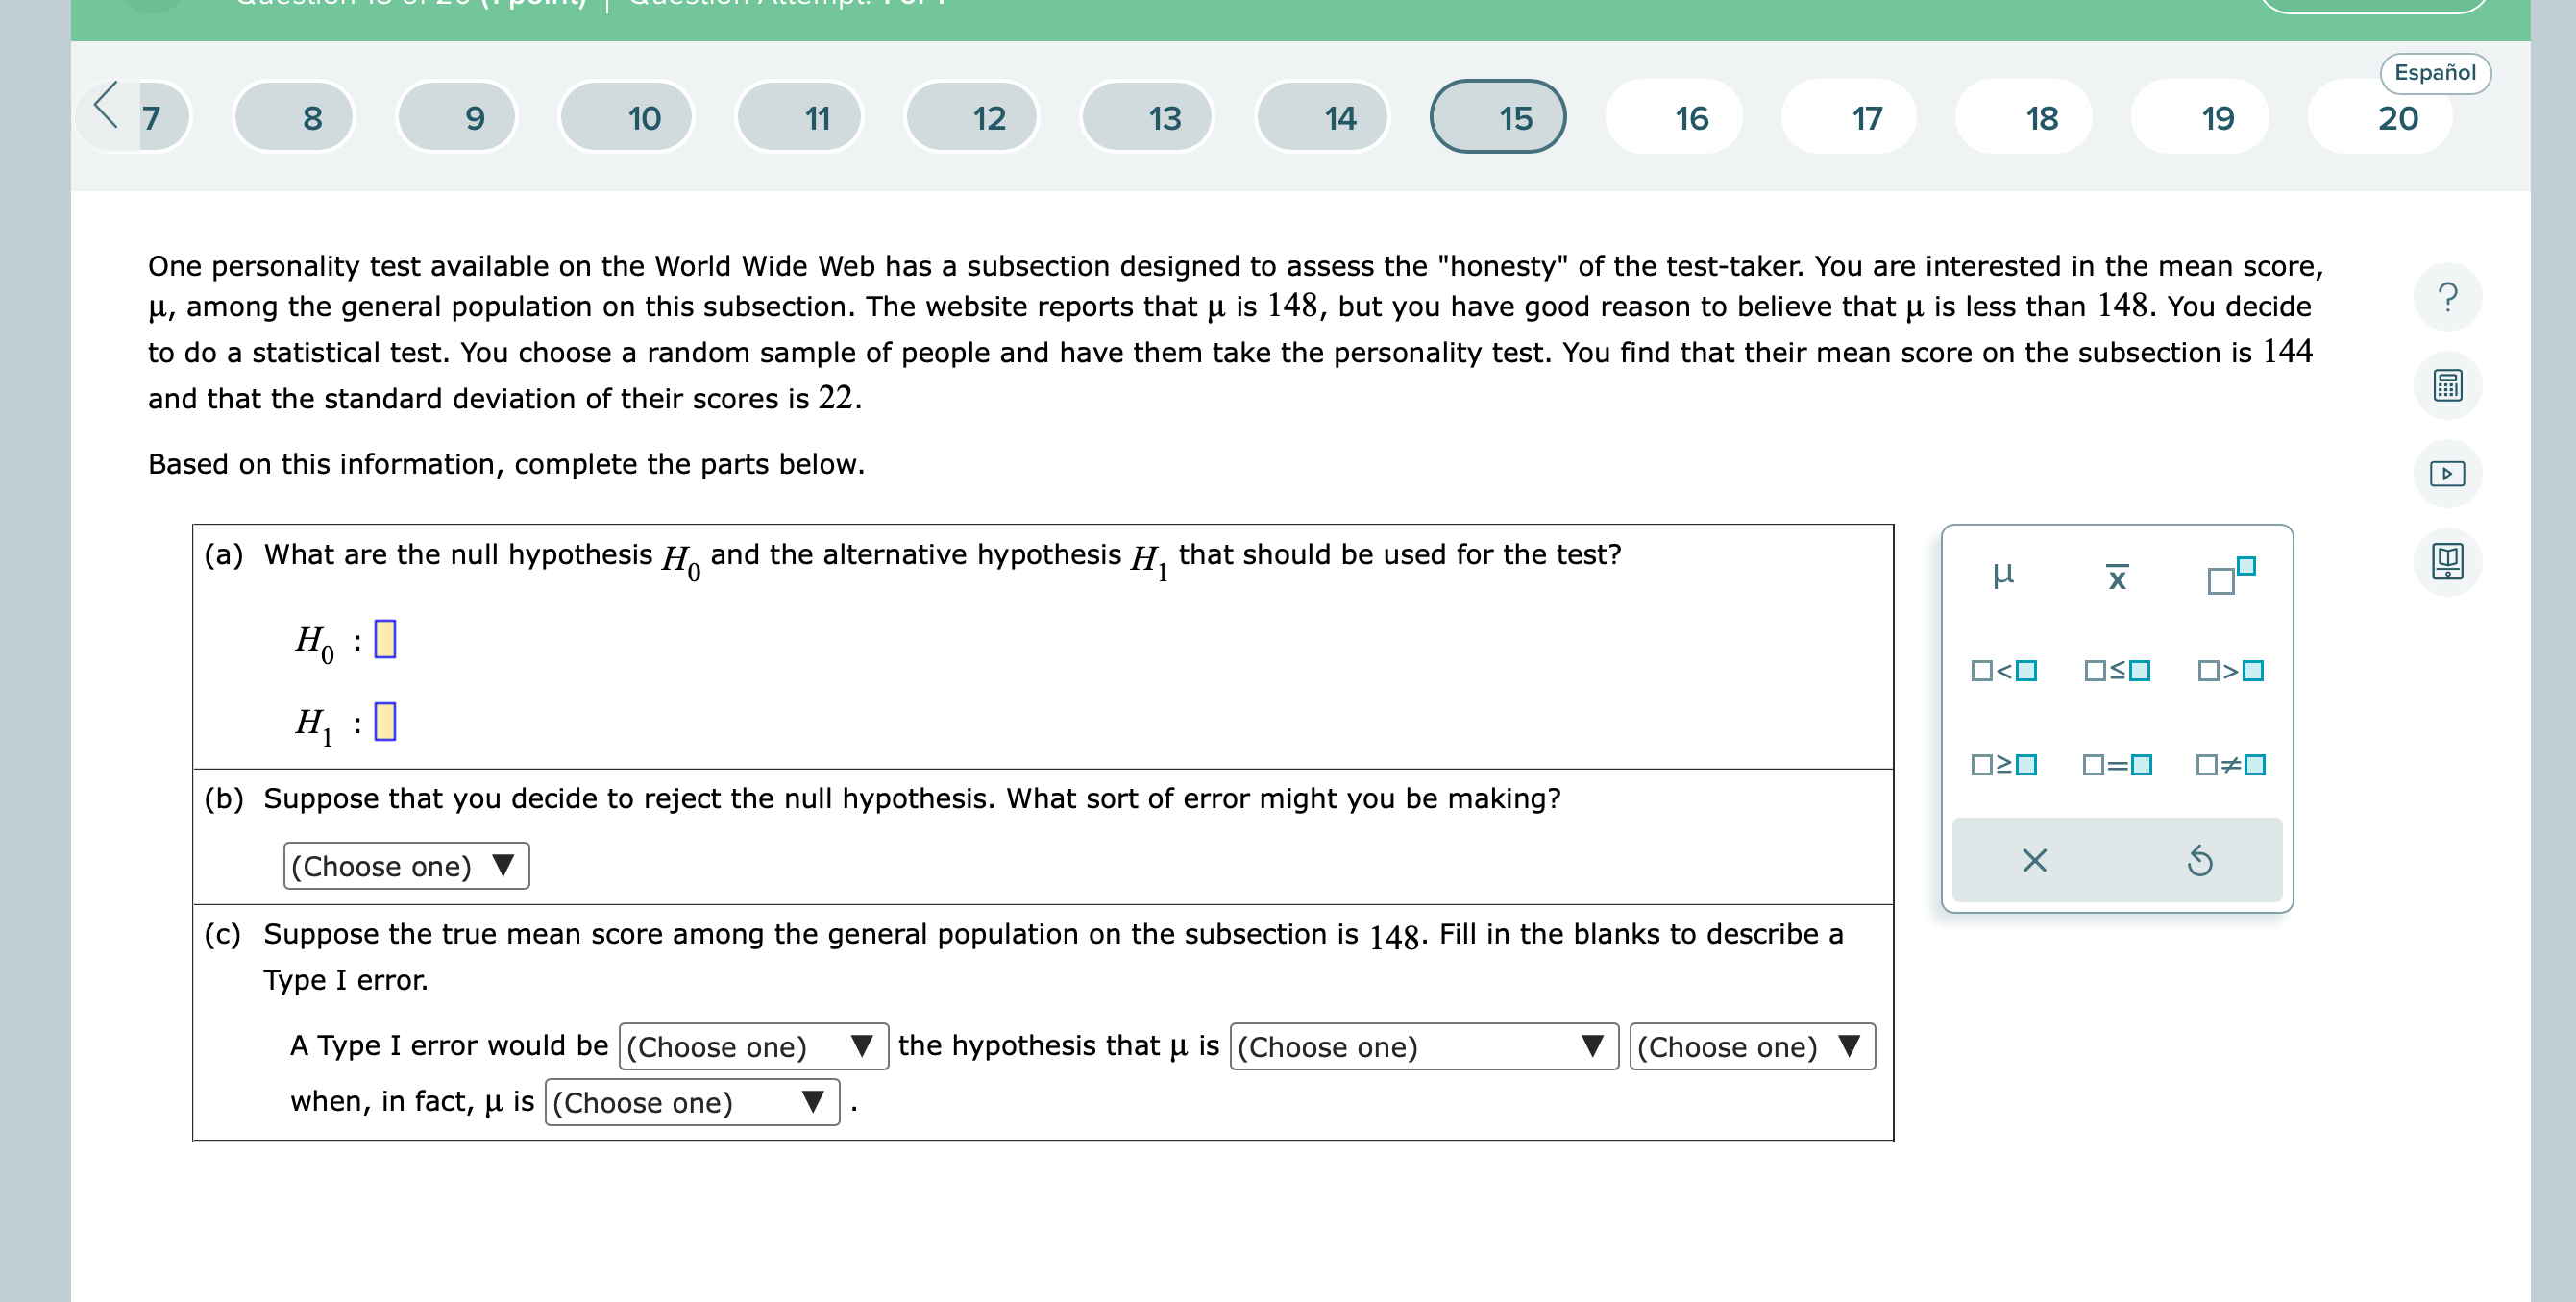
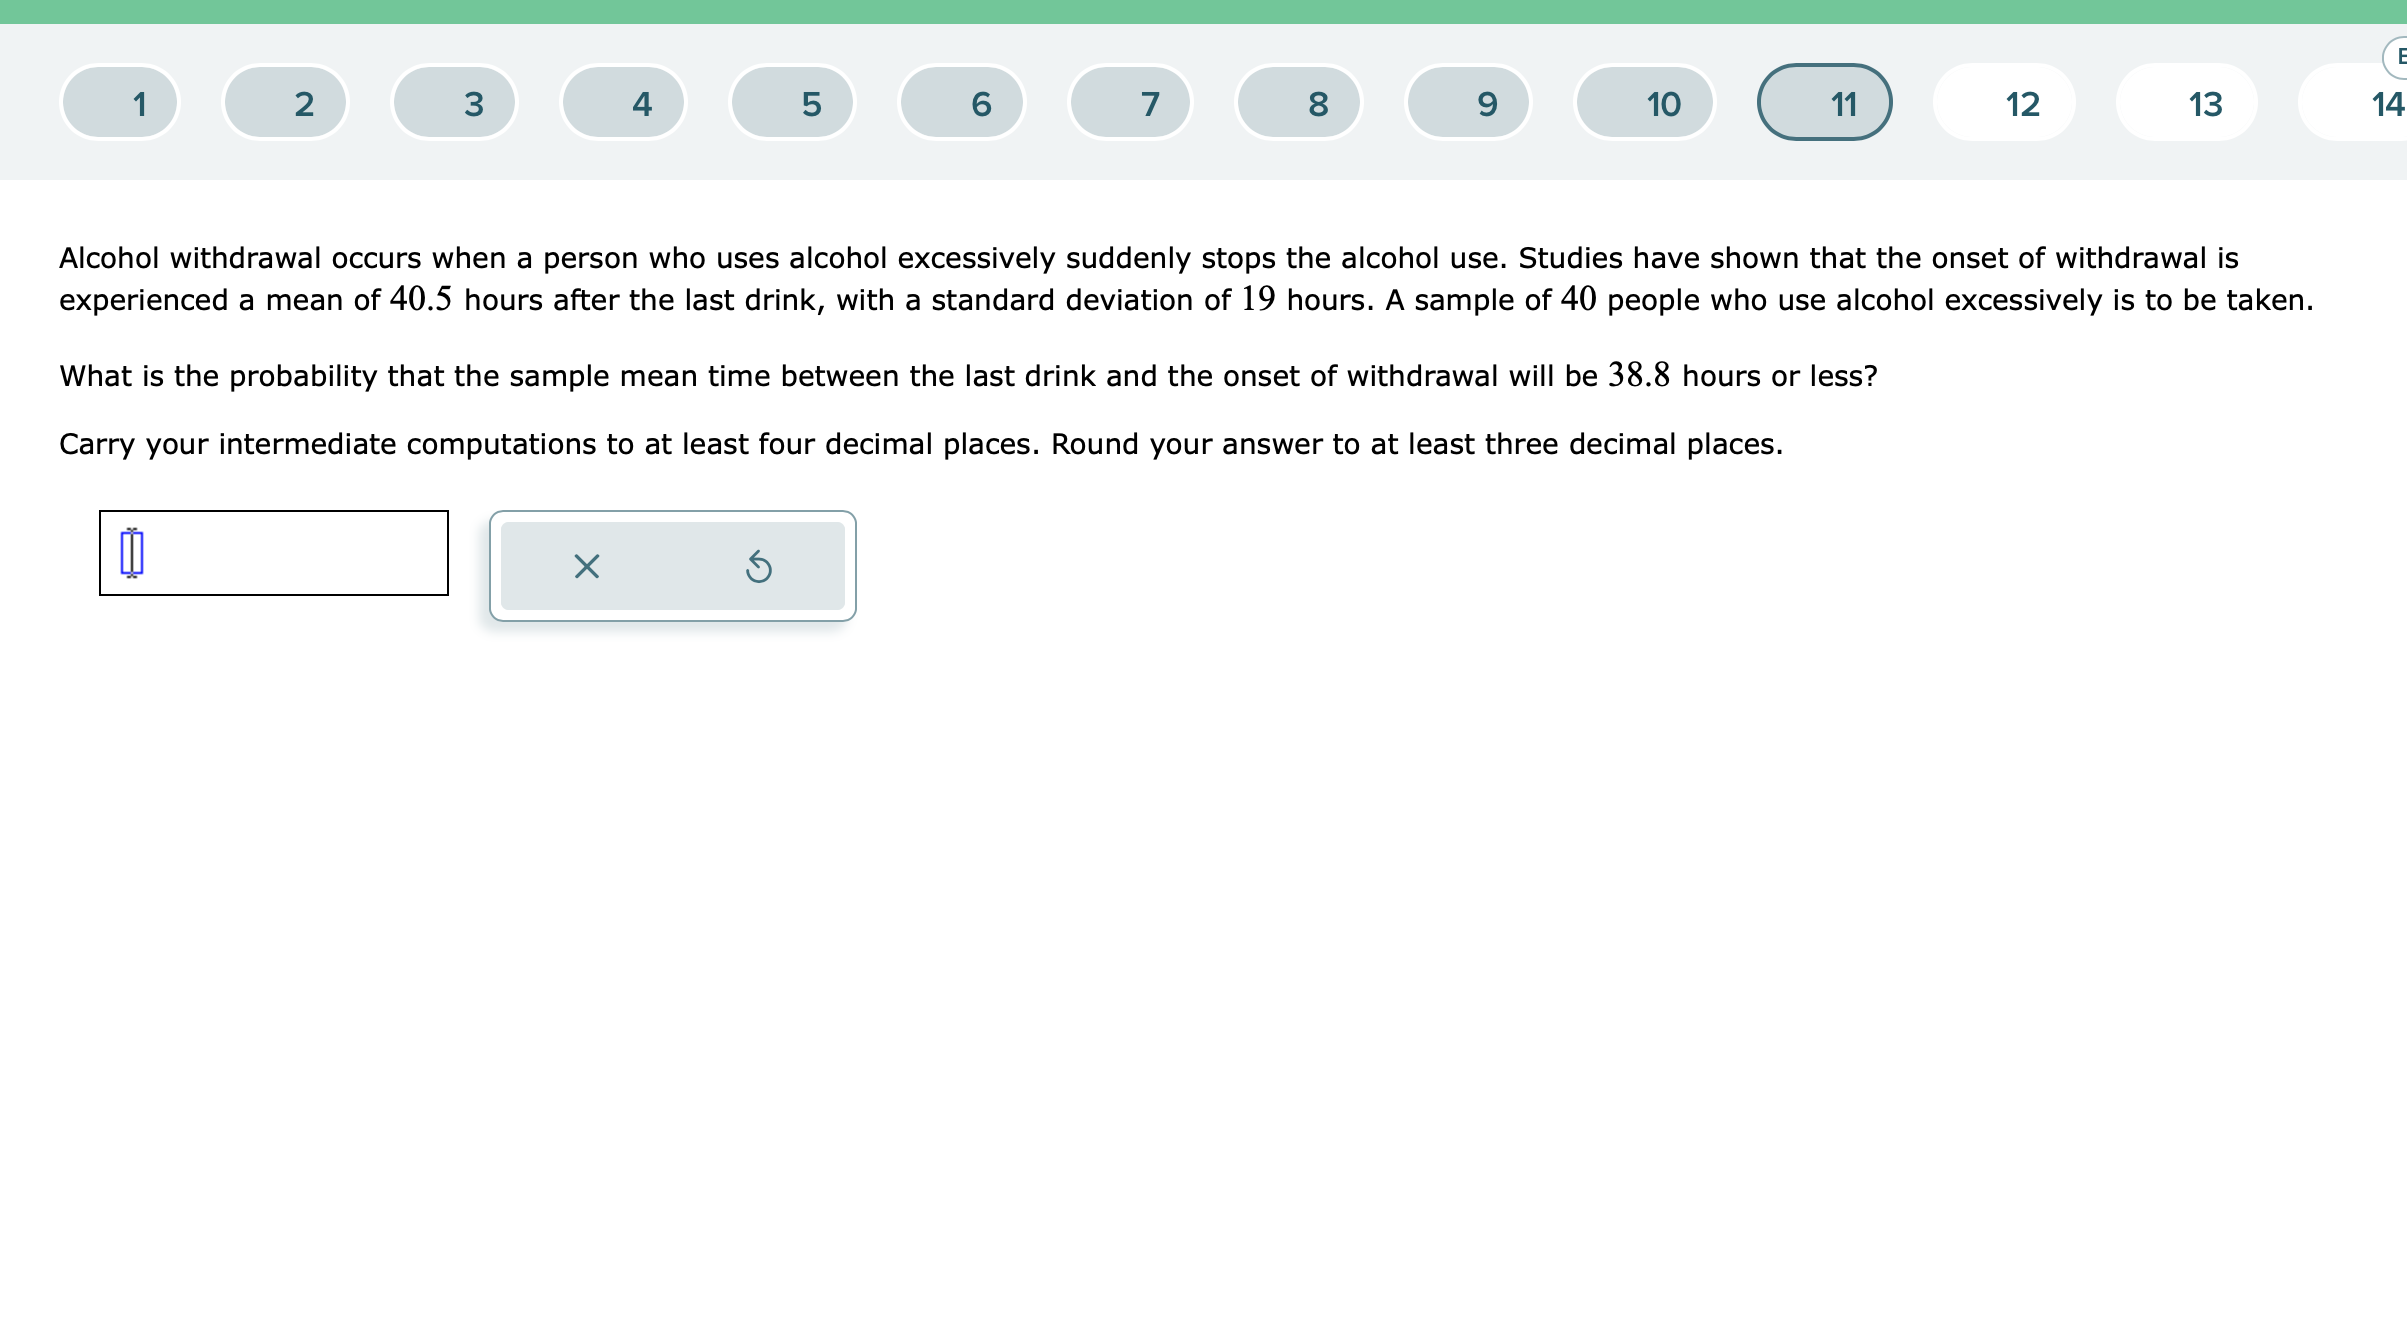
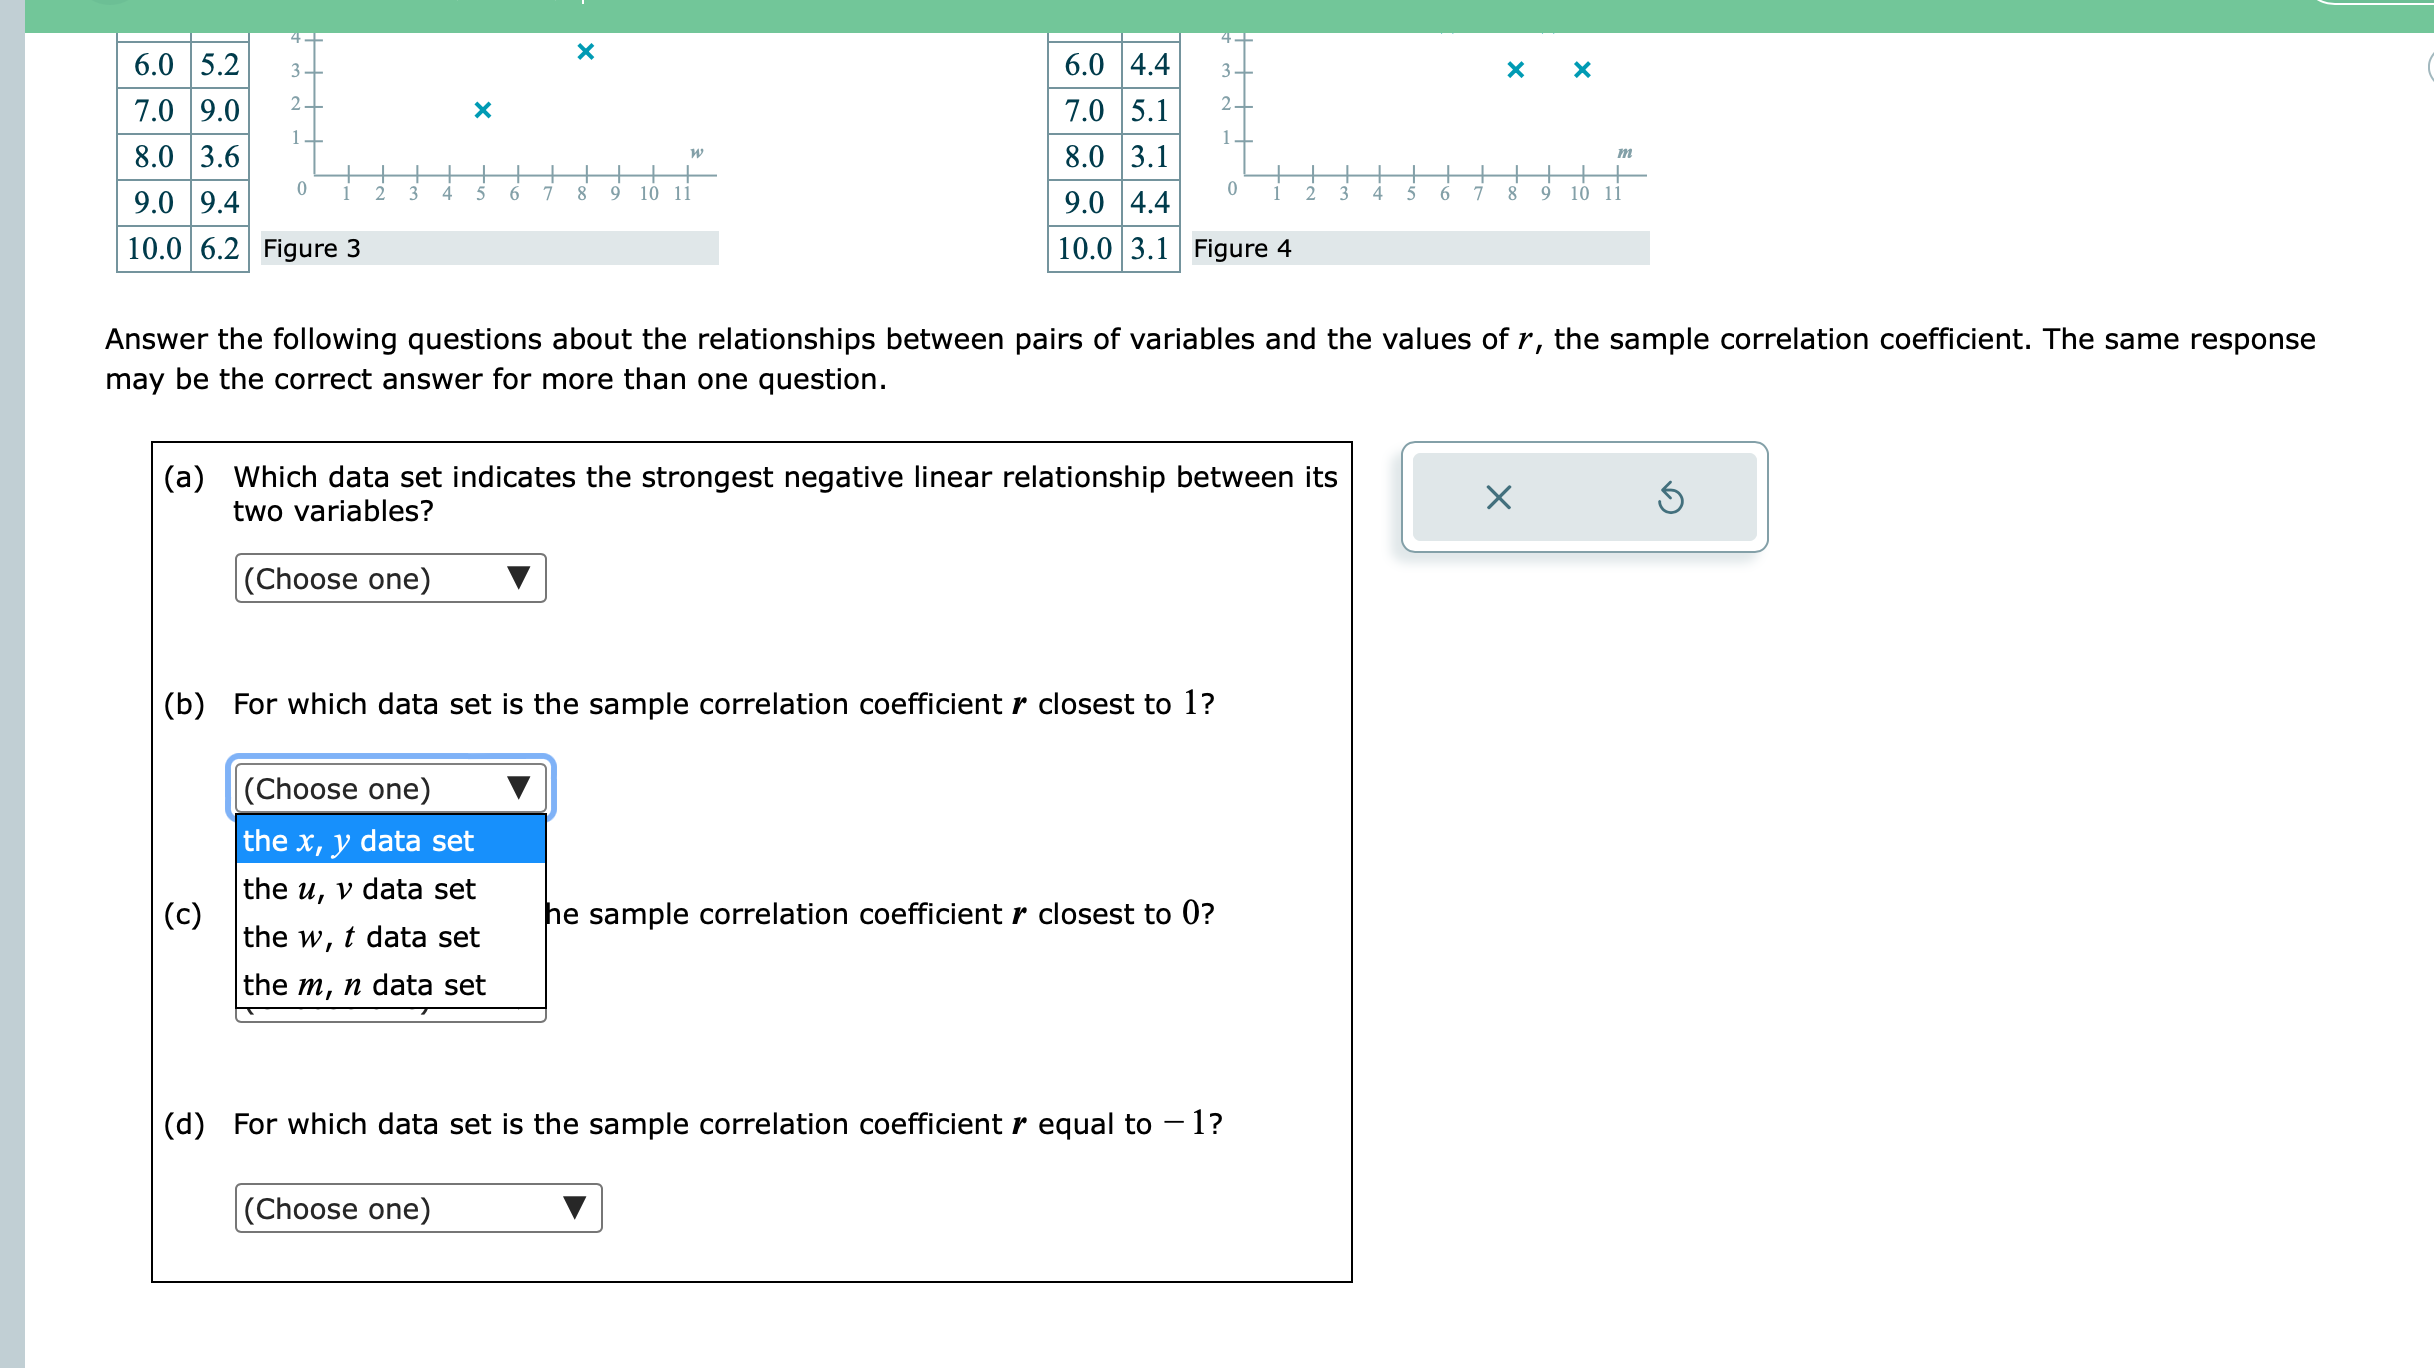
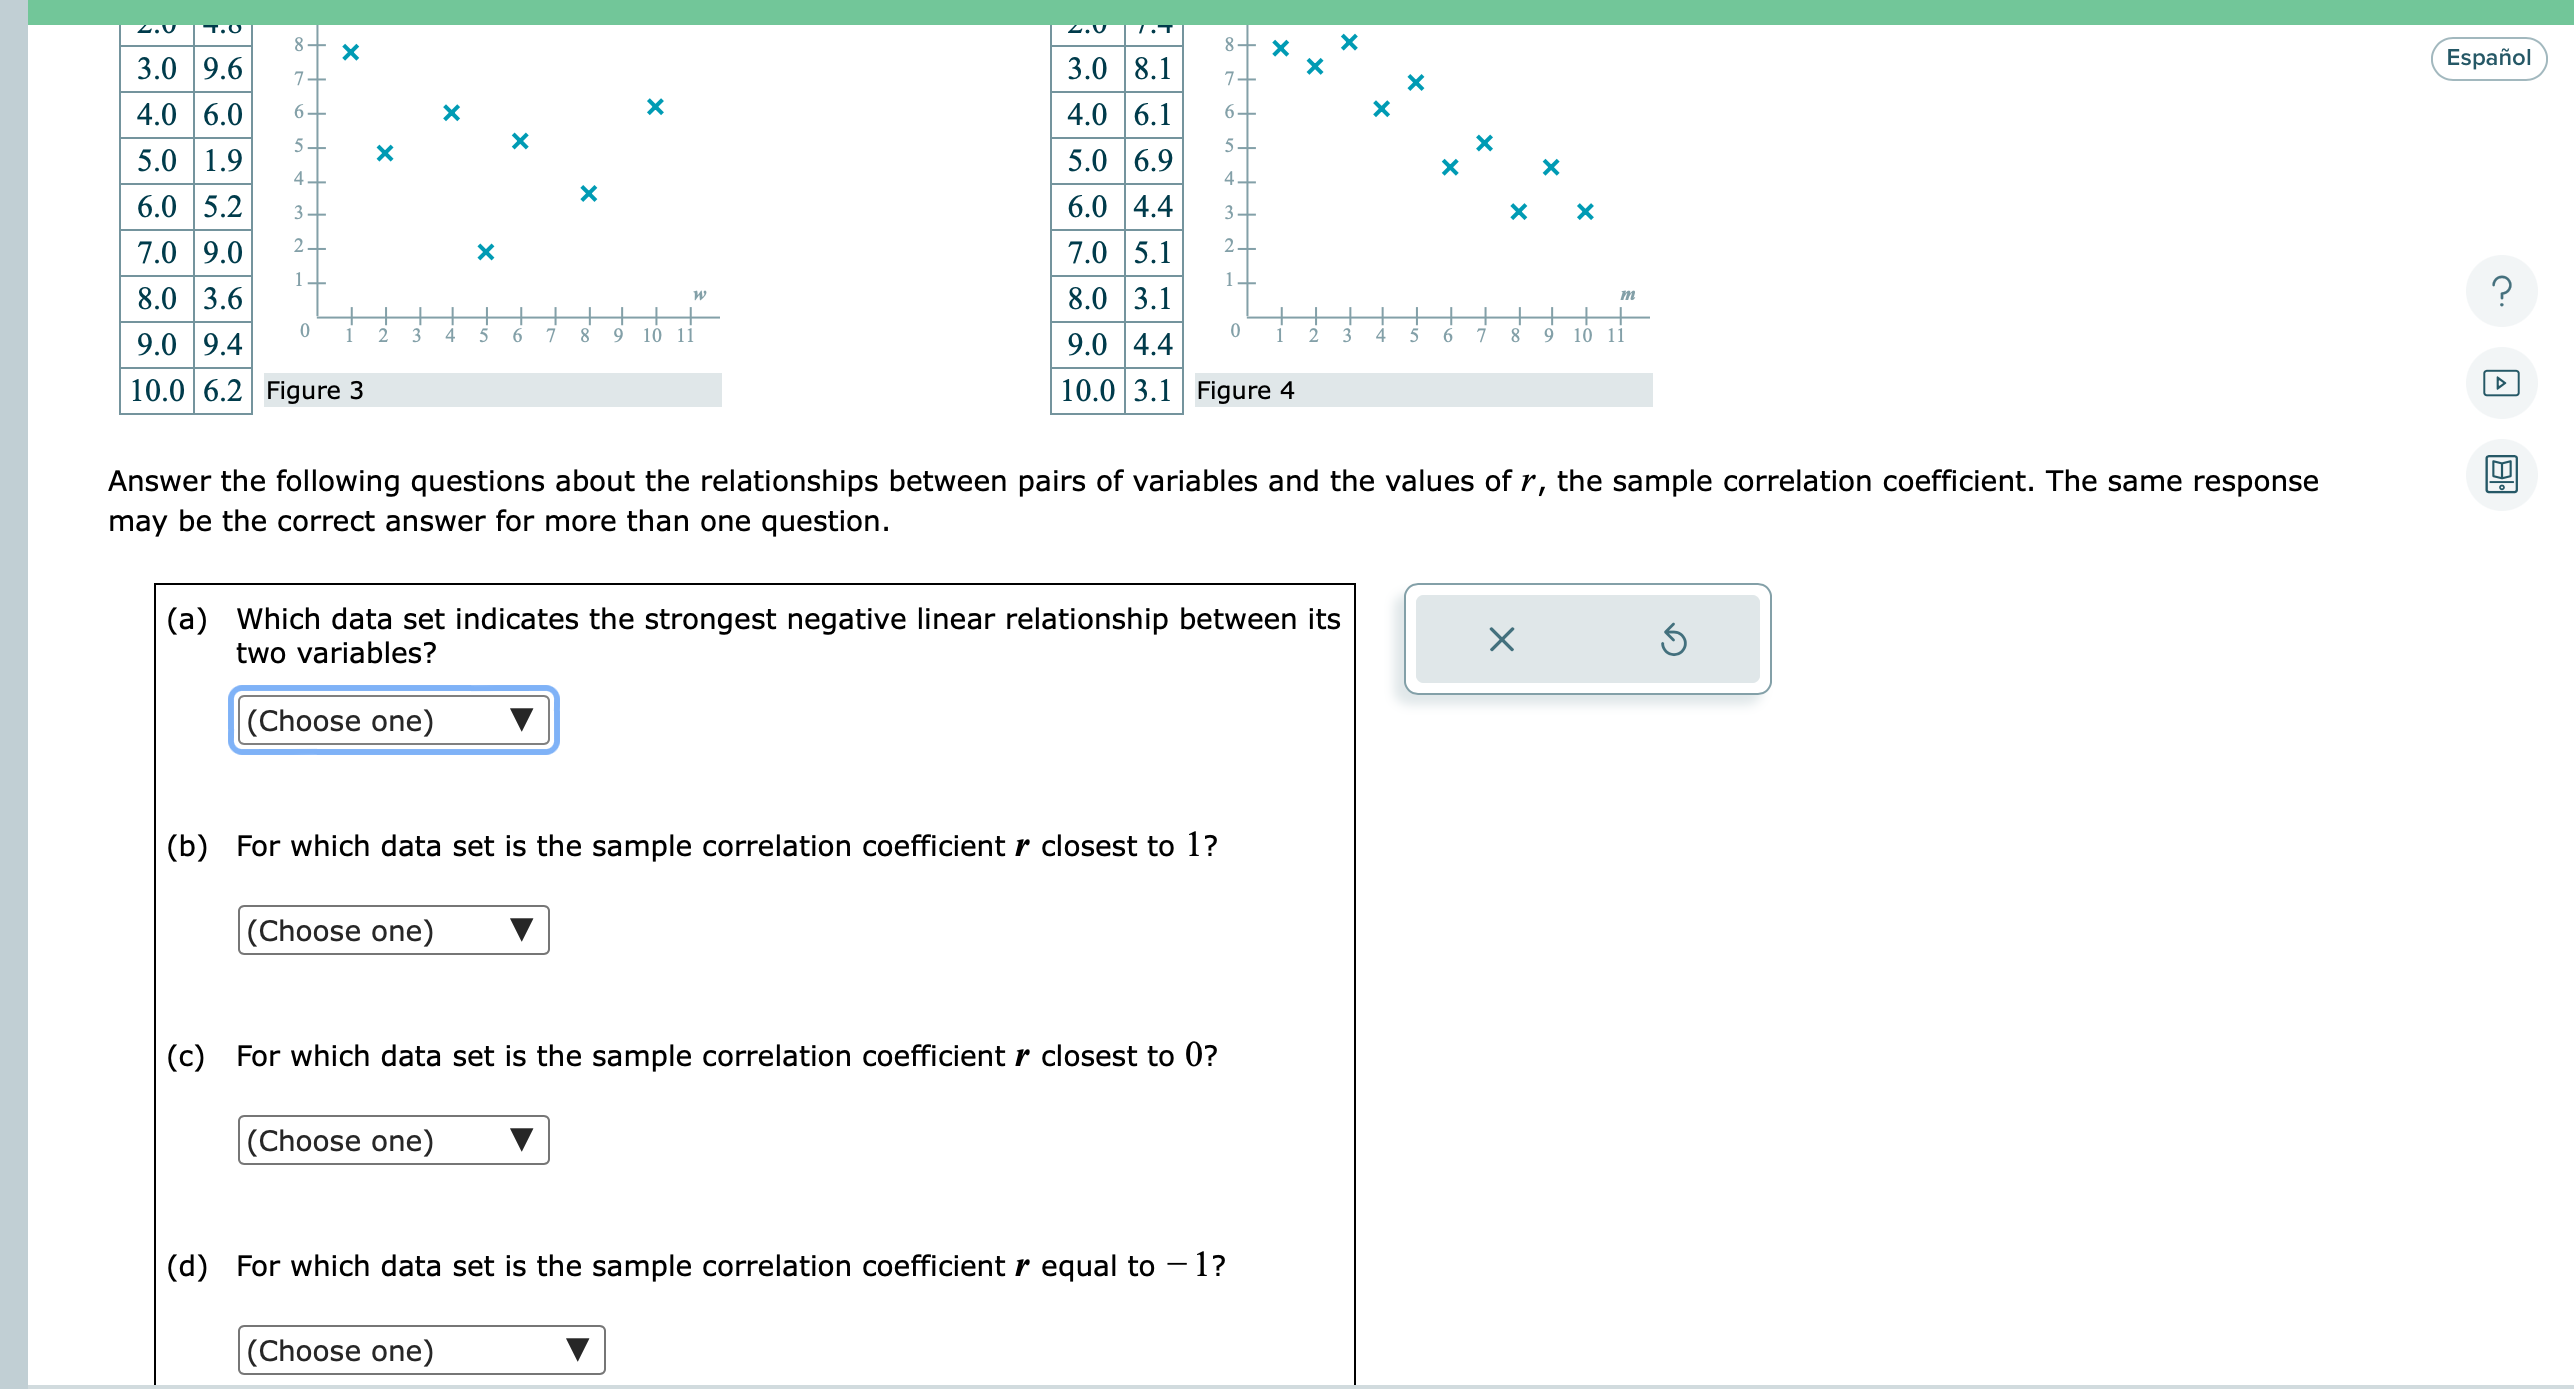
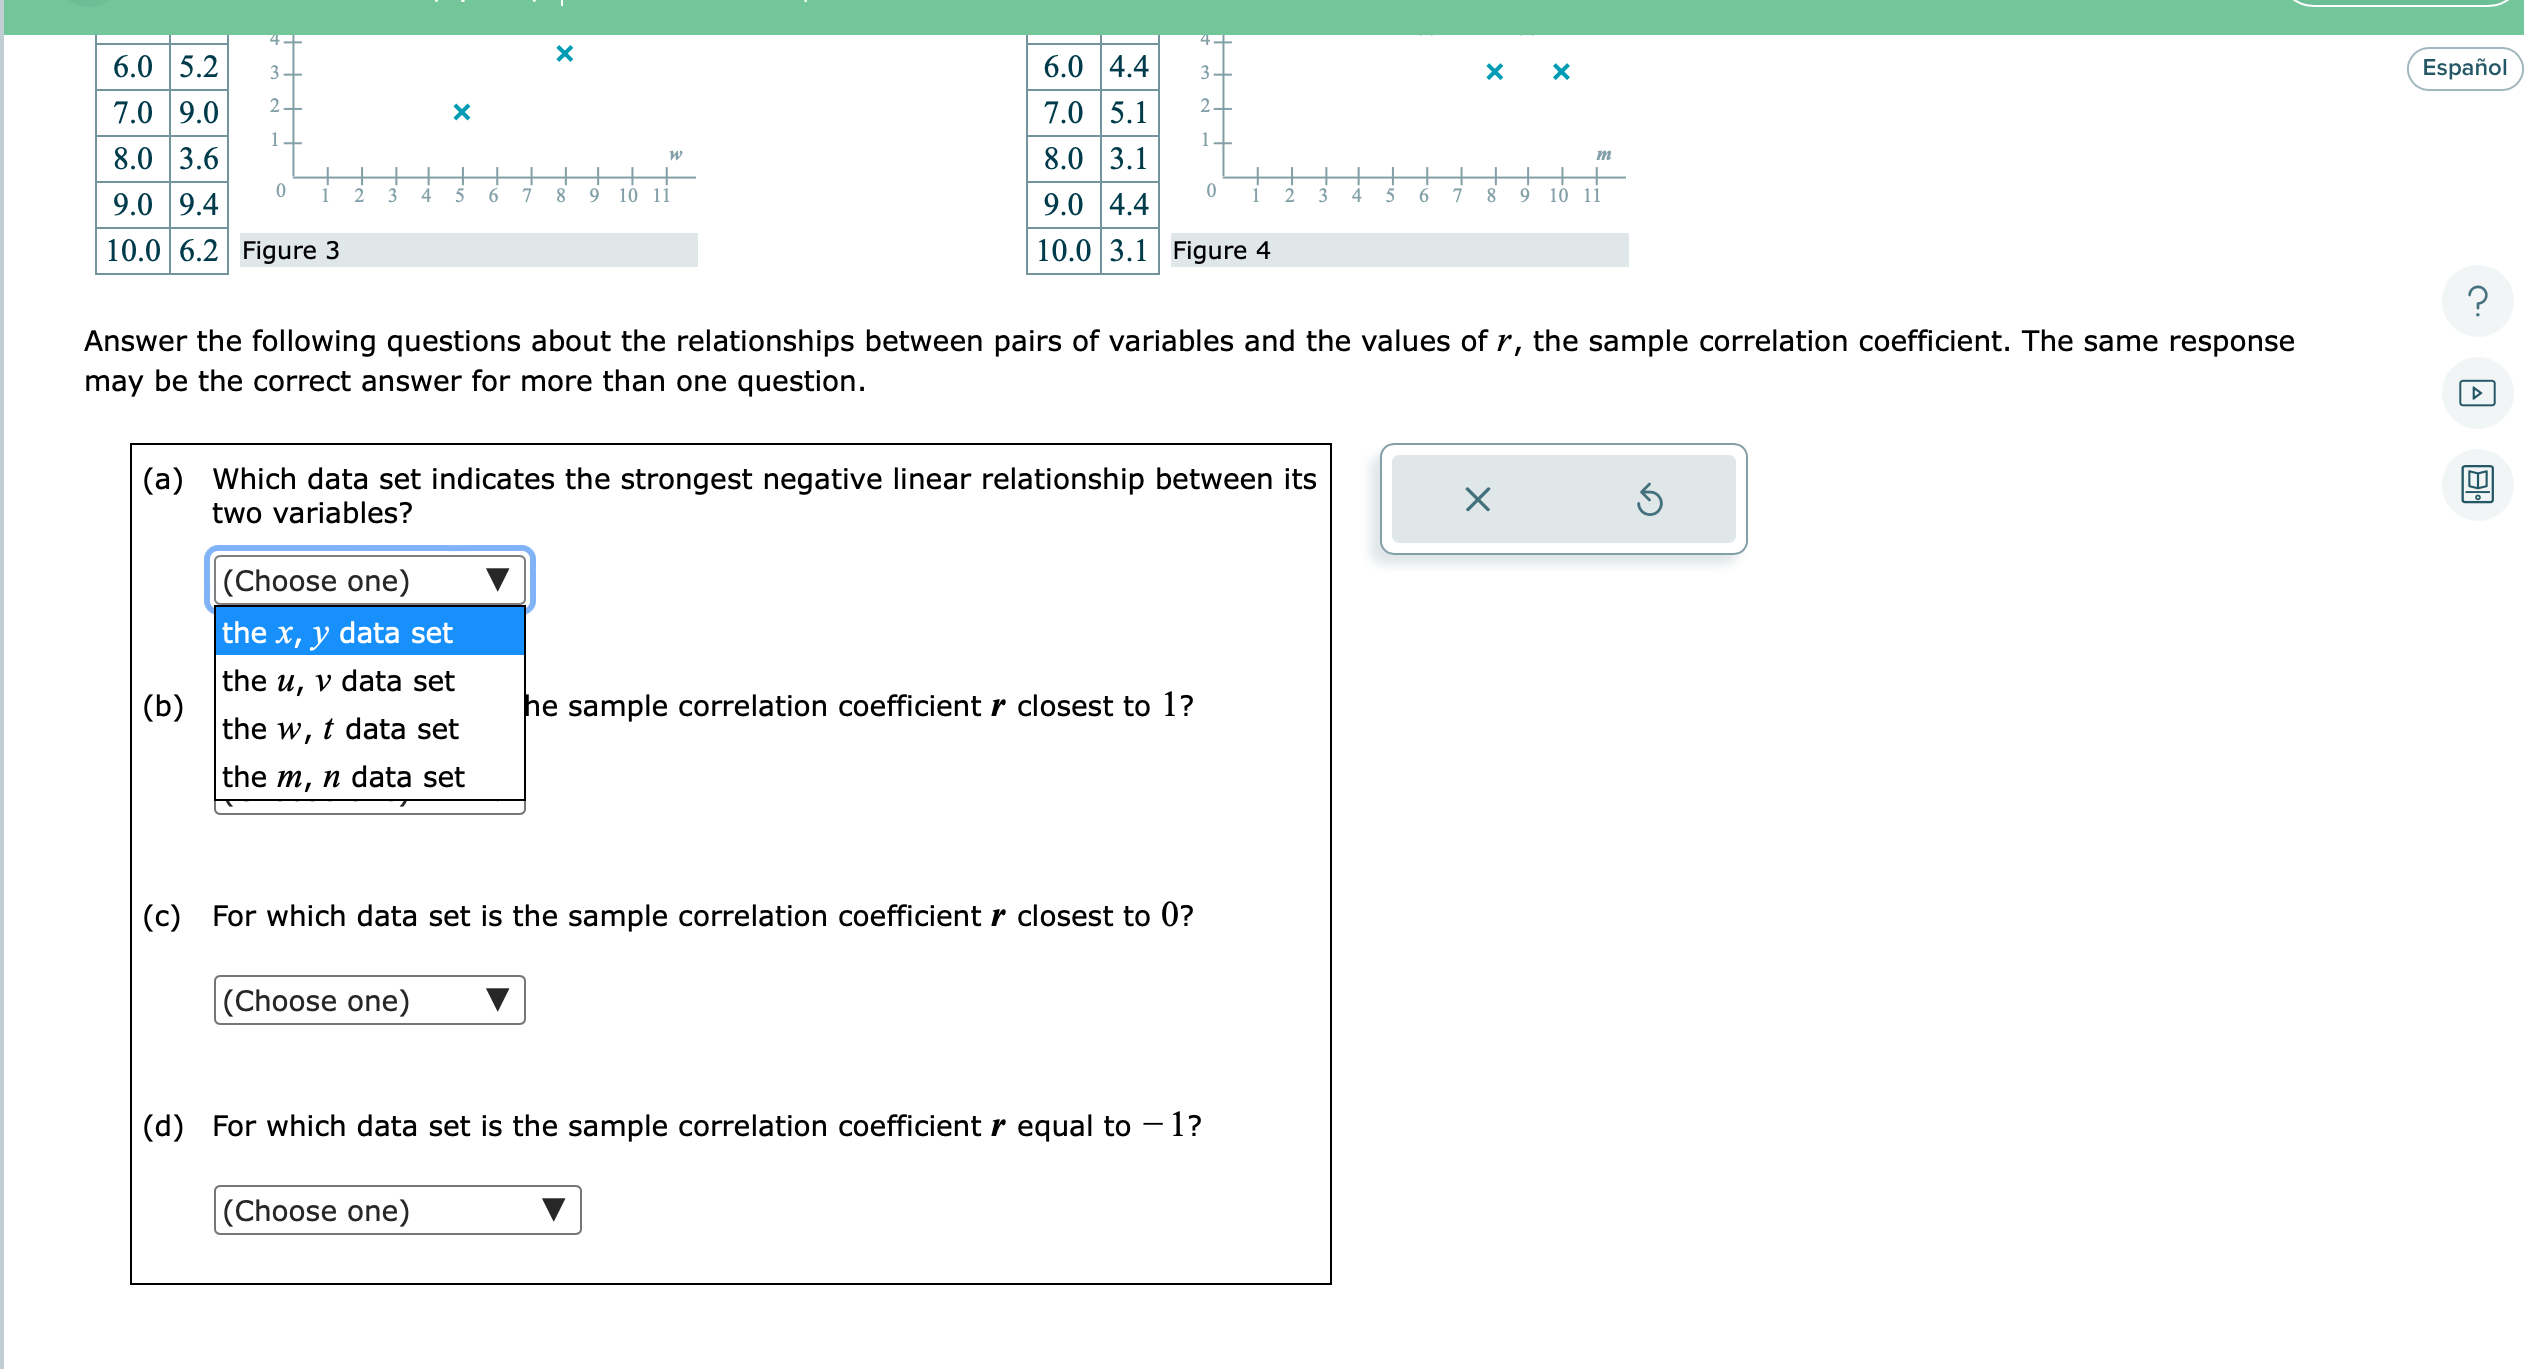
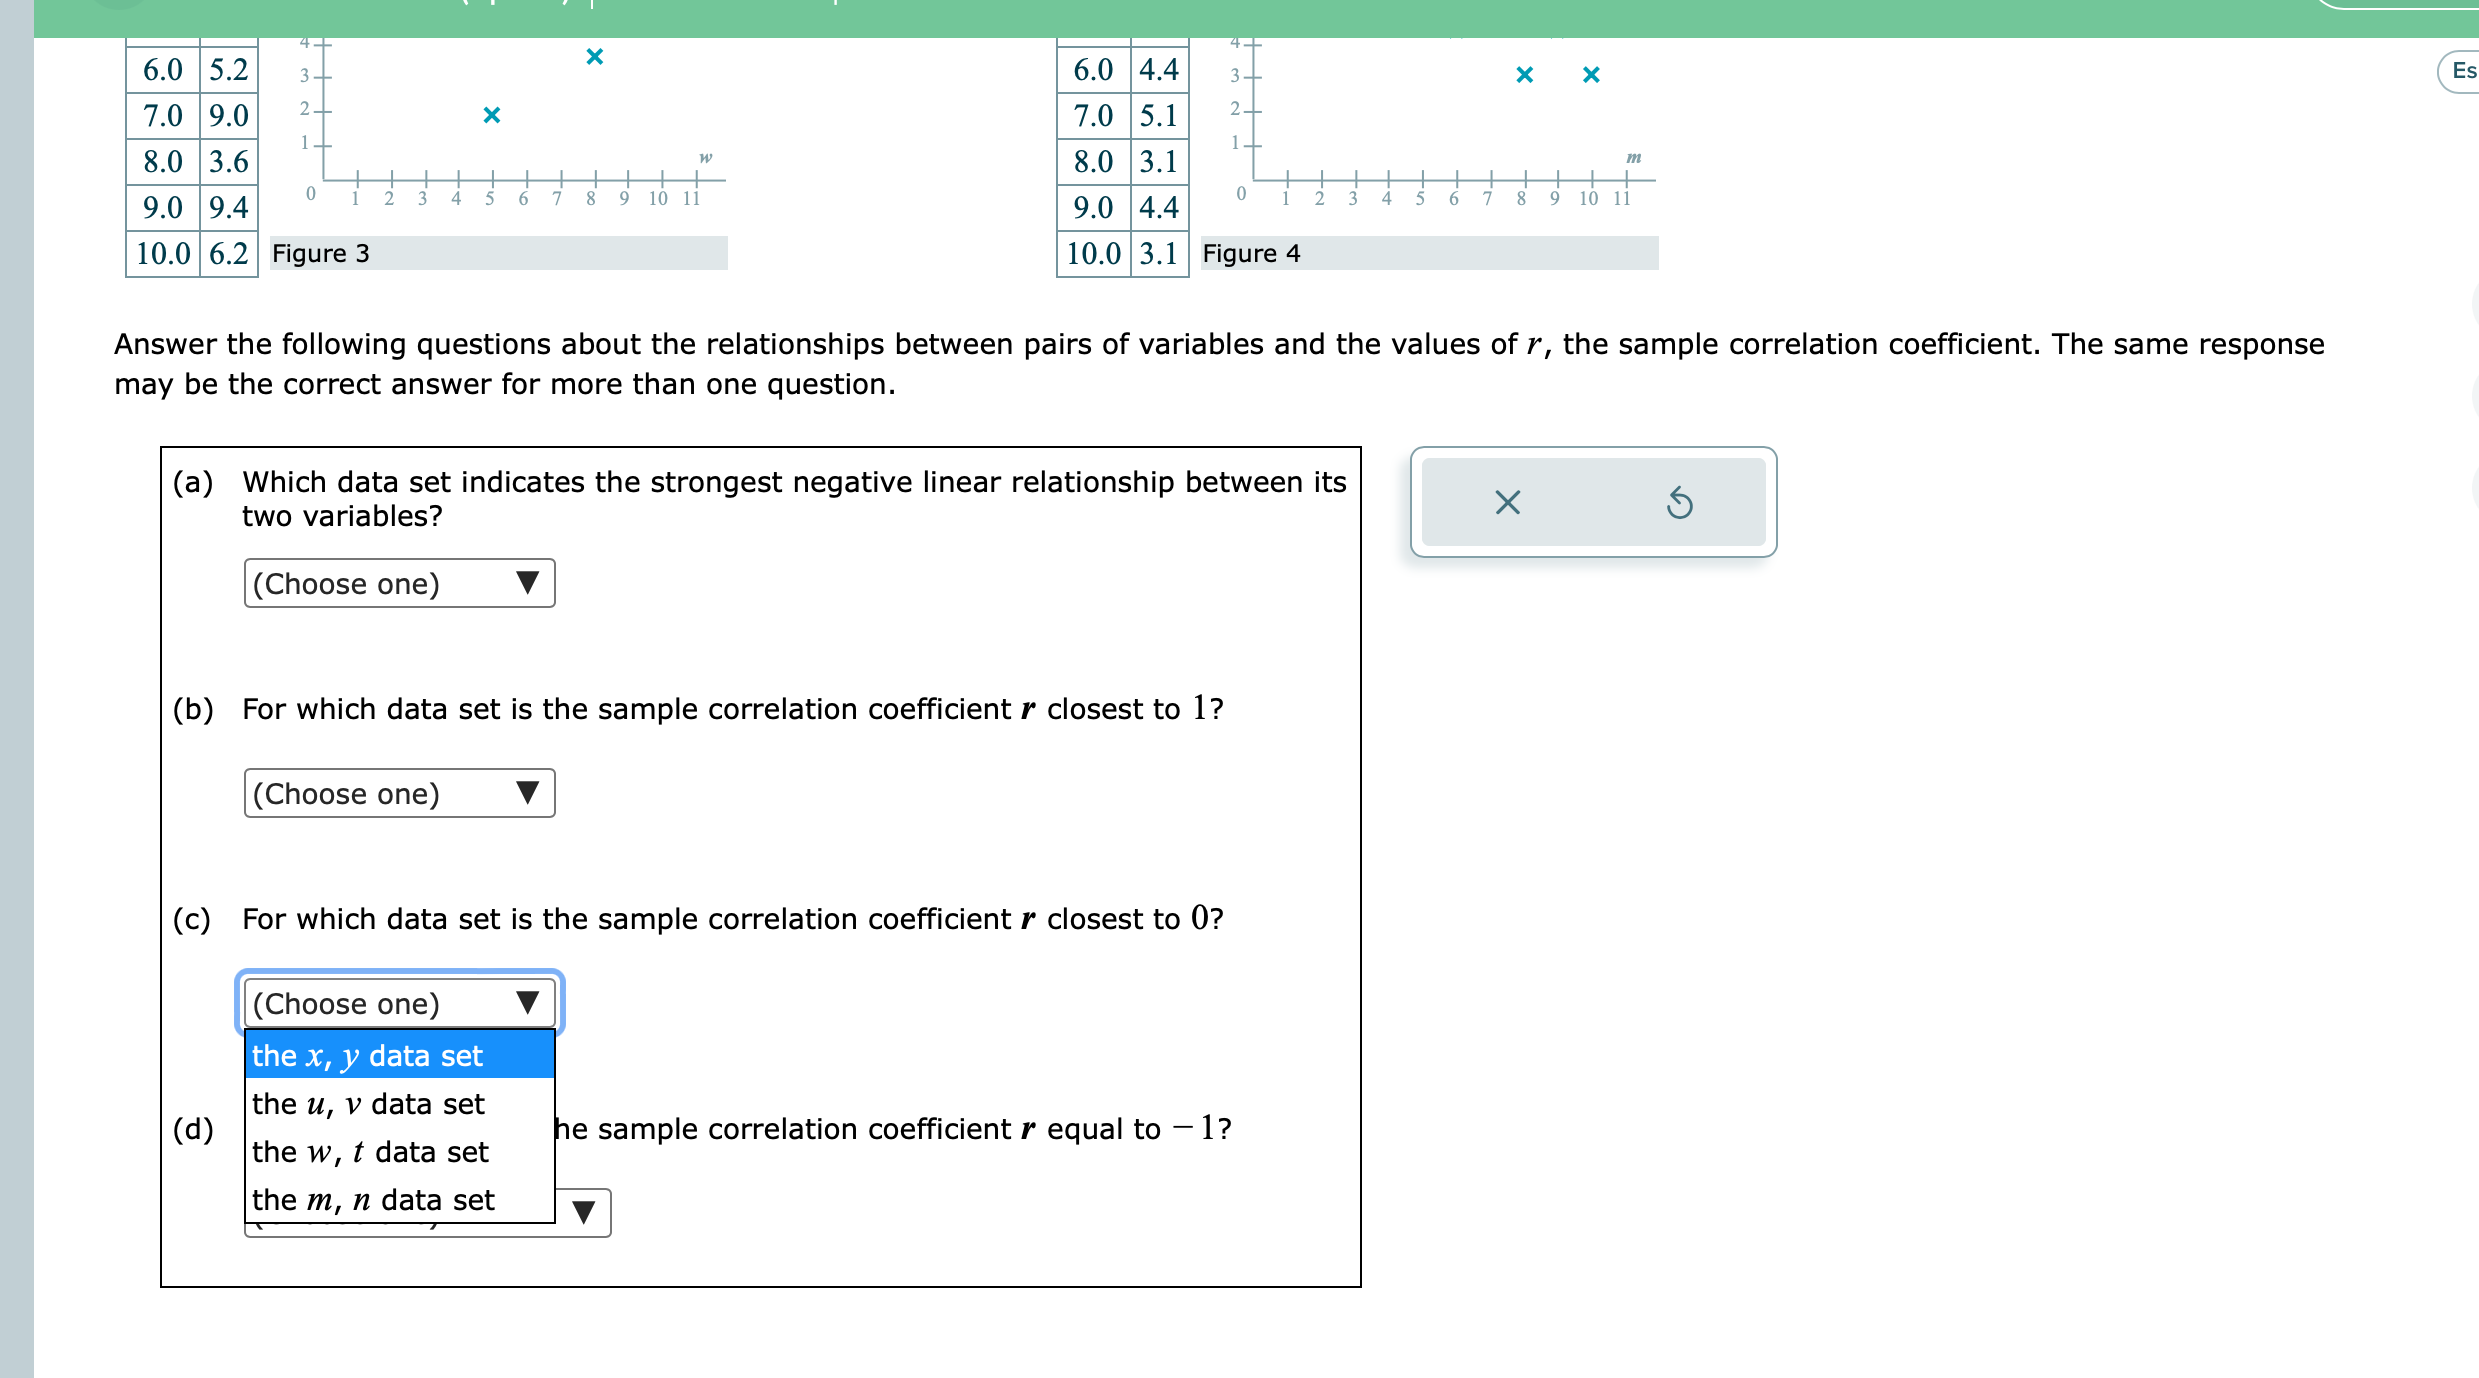
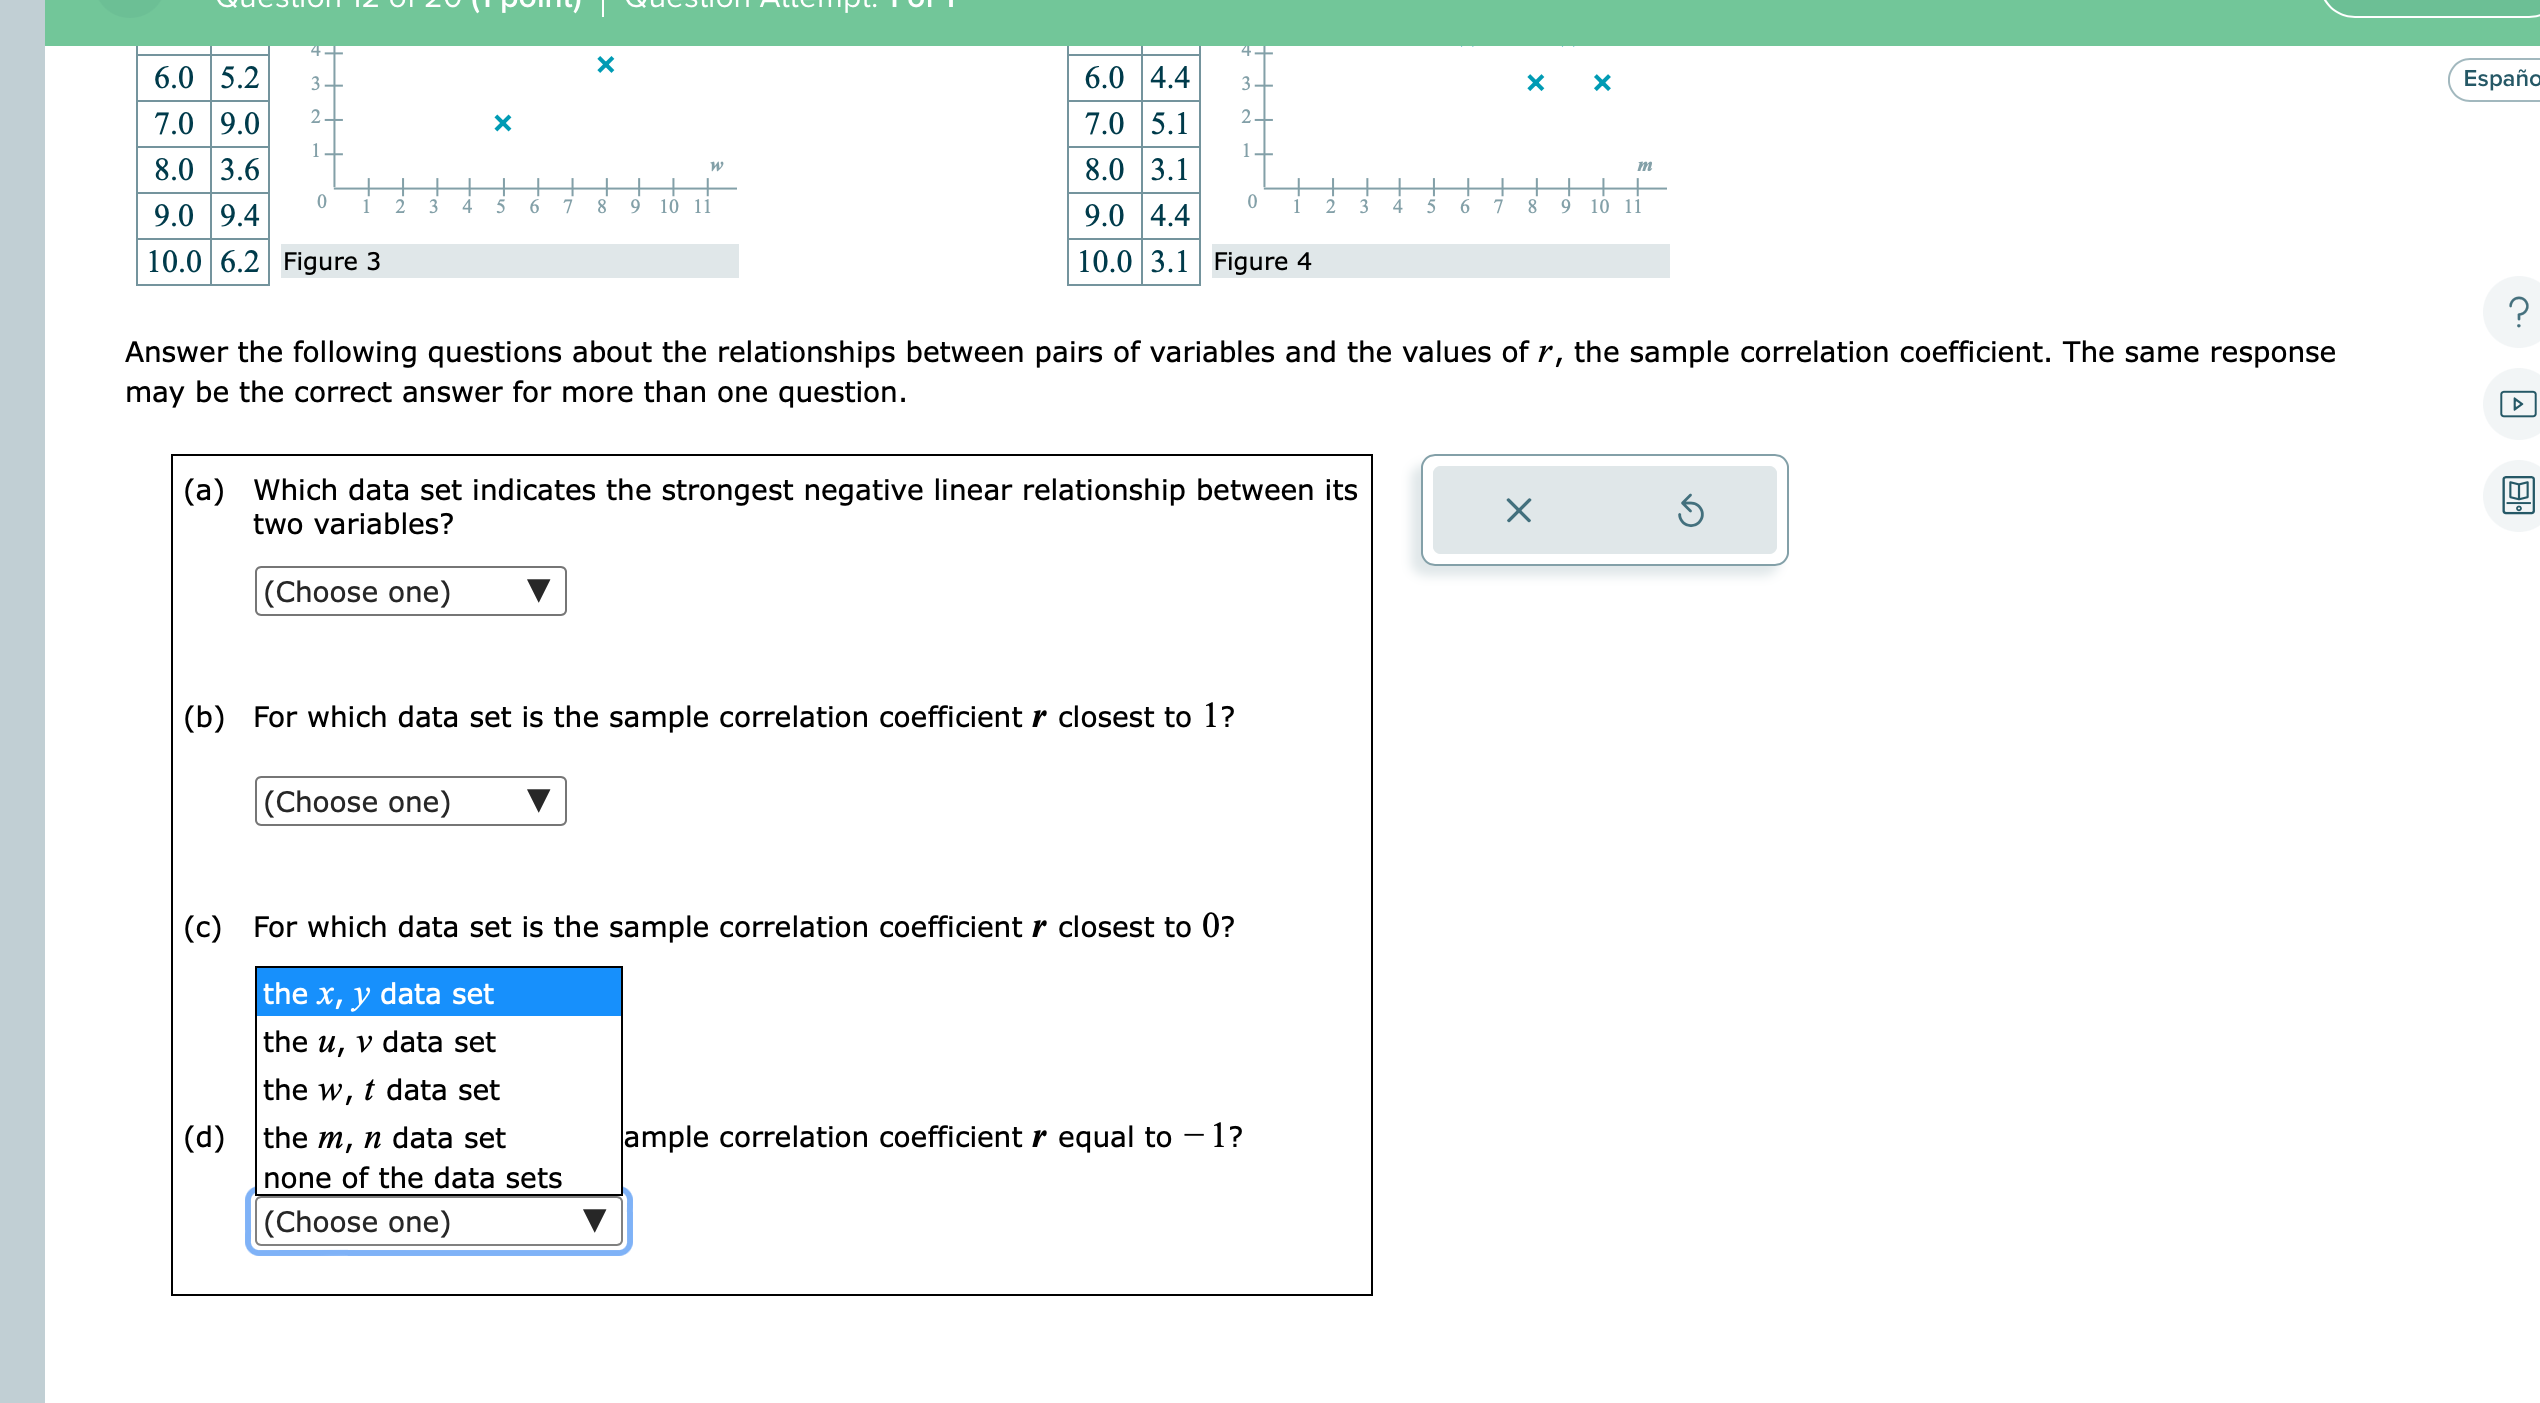
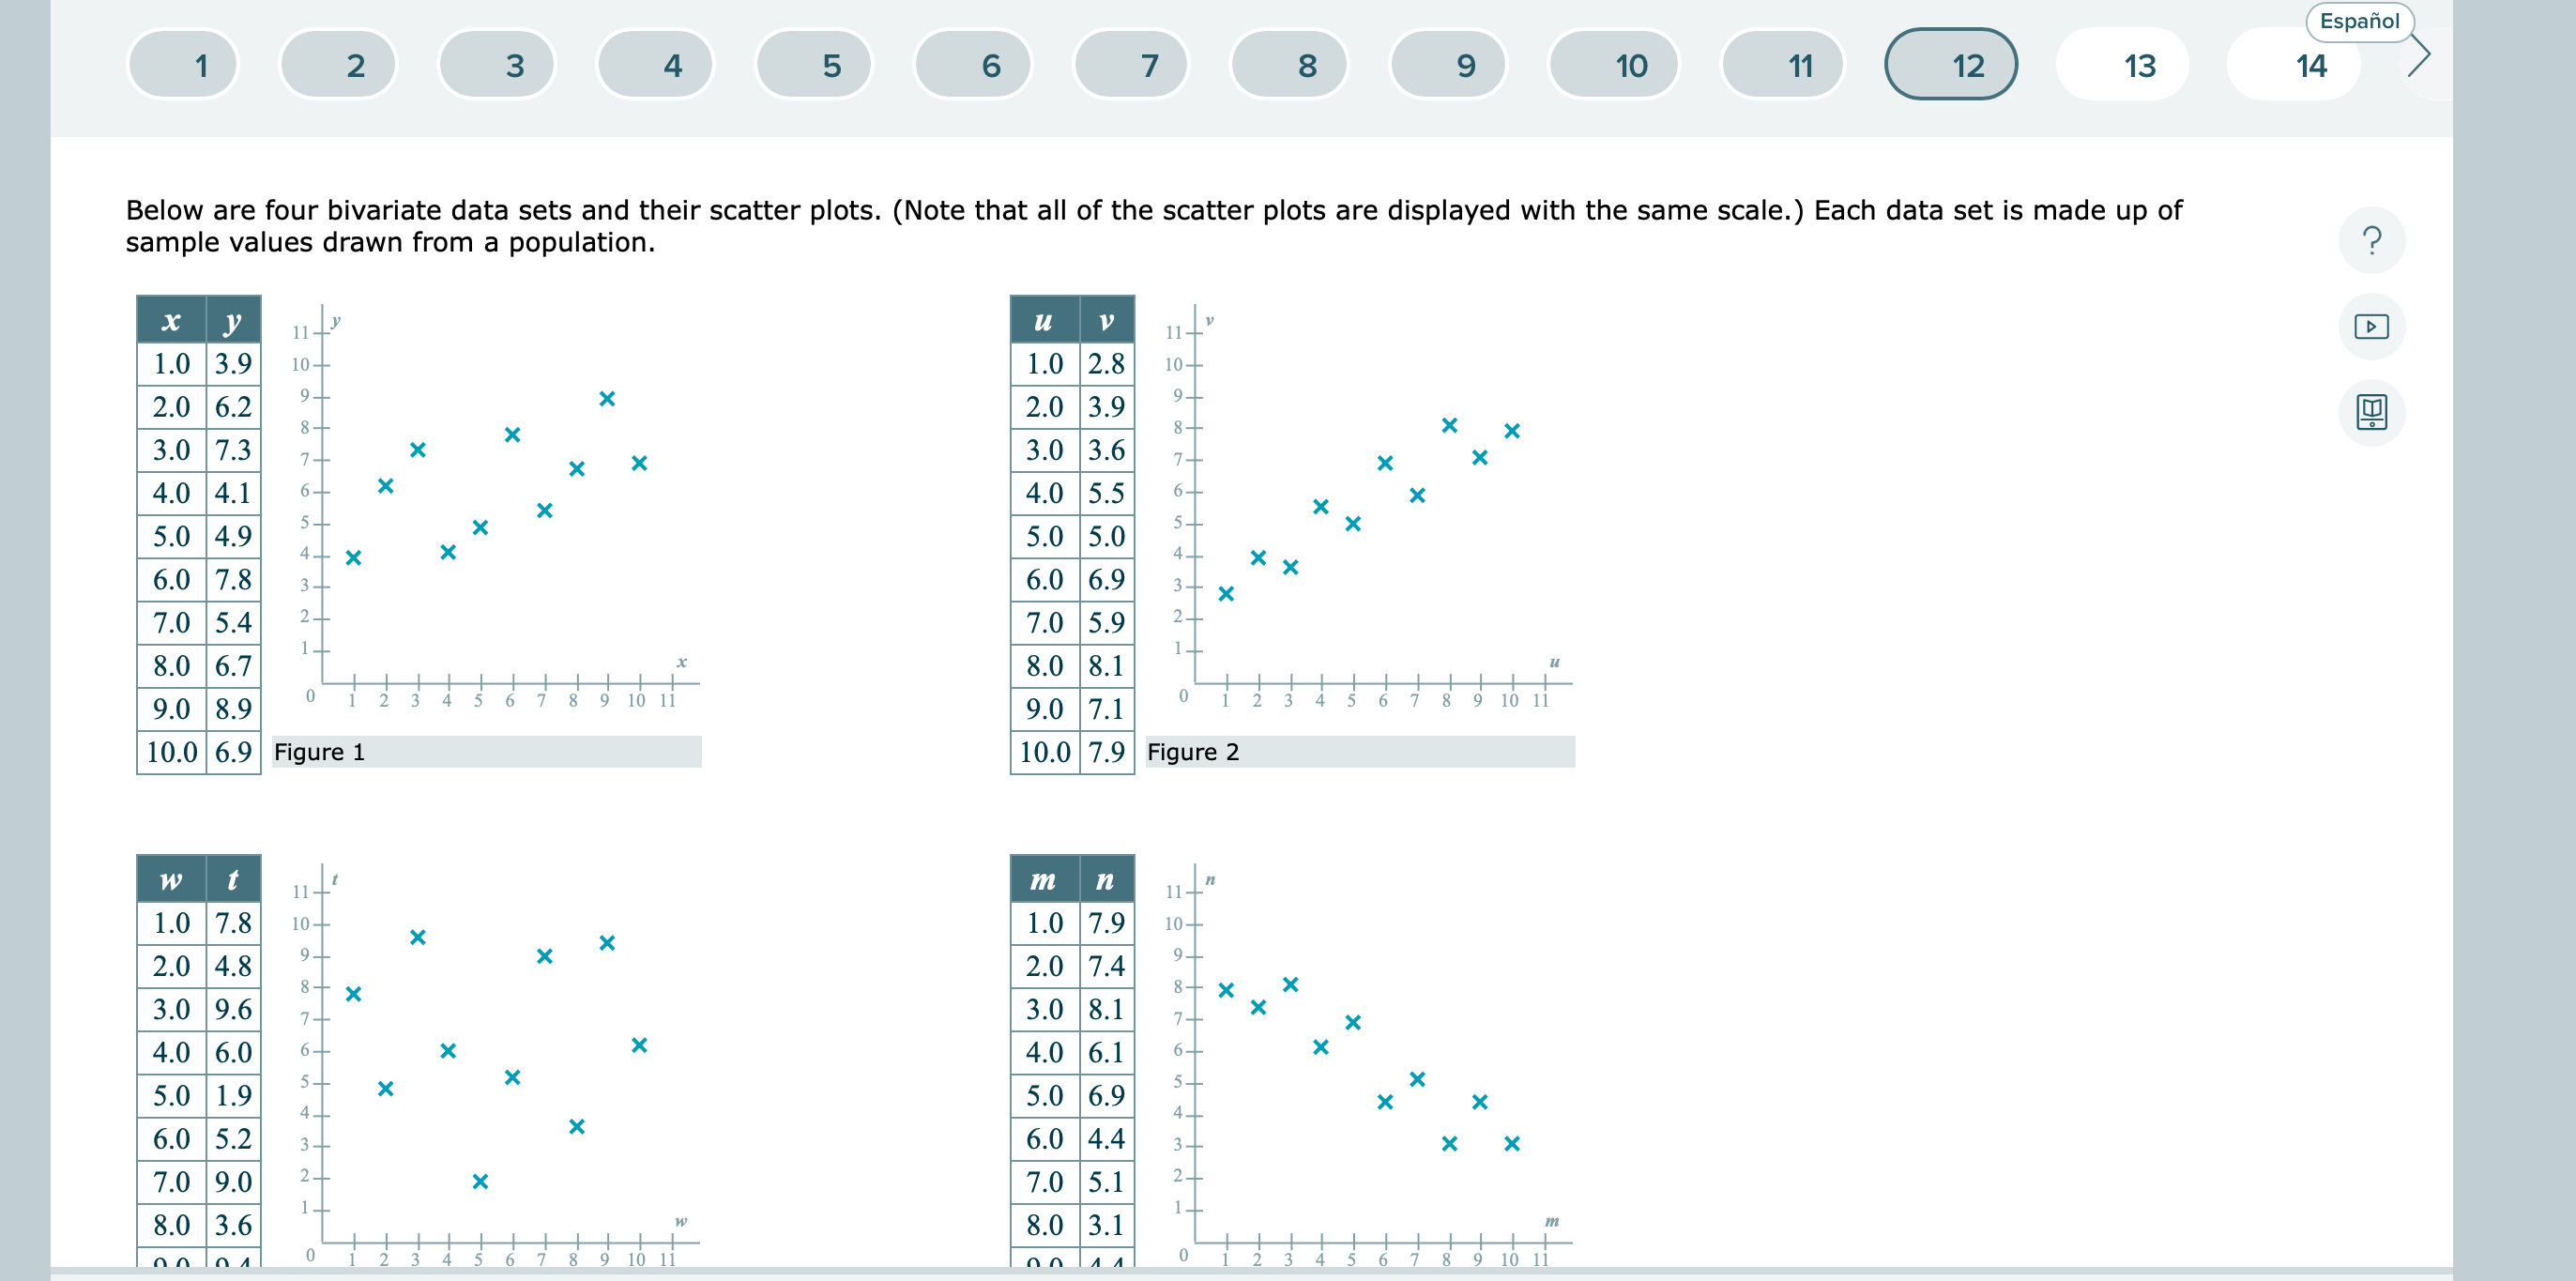
1 2 3 4 5 6 7 8 9 10 G) 12 13 Alcohol withdrawal occurs when a person who uses alcohol excessively suddenly stops the alcohol use. Studies have shown that the onset of withdrawal is experienced a mean of 40.5 hours after the last drink, with a standard deviation of 19 hours. A sample of 40 people who use alcohol excessively is to be taken. What is the probability that the sample mean time between the last drink and the onset of withdrawal will be 38.8 hours or less? Carry your intermediate computations to at least four decimal places. Round your answer to at least three decimal places. ] / x s 6.0 5.2 f. x 6.0 4.4 a x x 7.0 9.0 3' X 7.0 5.1 3 - l 80 36 r' l l \\l l l l - l l - 1H 80 3'1 \" l .1 l ' l l - l l 1 lm 910 9.4 ' 1 1 ' ' j I' N U' 1\" H 9.0 4.4 l 1 '~ l > (, s v 1' ll 10.0 6.2 Figure3 10.0 3.1 Figure4 Answer the following questions about the relationships between pairs of variables and the values of r, the sample correlation coefficient. The same response may be the correct answer for more than one question. (a) Which data set indicates the strongest negative linear relationship between its two variables? (Choose one) V (b) For which data set is the sample correlation coefficient r closest to 1? (Choose one) V the x, y data set the u, v data set _ _ _ e sample correlation coeffICIent r closest to 0? the w, t data set the m, n data set (d) For which data set is the sample correlation coefficient r equal to 1? (Choose one) V 3.0 9.6 i x 3.0 8.1 i x x x 551335\" 4.0 6.0 \"a x 4.0 6.1 7 5.0 1.9 '7 5.0 6.9 17 6.0 5.2 6.0 4.4 a . x 7.0 9.0 3* 7.0 5.1 , 8.0 3.6 ' 1 8.0 3.1 ' p ' 1 1 1'" '? 9.0 9.4 \" \" 9.0 4.4 ' i 1 \" l\" ' 10.0 6.2 Figure 3 10.0 3.1 Figure 4 " Answer the following questions about the relationships between pairs of variables and the values of r, the sample correlation coefcient. The same response E may be the correct answer for more than one question. (a) Which data set indicates the strongest negative linear relationship between its ('9 E o | 2r] l=|'l #l ean score among the general population on the subsection is 148. Fill in the blanks to describe a Type I error. AType I error would be (Choose one) V the hypothesis that p is '(Choose one) V \"(Choose one) V ' when, in fact, u is (Choose one) V . Espanol 7 8 9 10 11 12 13 14 15 16 17 18 19 20 One personality test available on the World Wide Web has a subsection designed to assess the "honesty" of the test-taker. You are interested in the mean score, u, among the general population on this subsection. The website reports that u is 148, but you have good reason to believe that u is less than 148. You decide to do a statistical test. You choose a random sample of people and have them take the personality test. You find that their mean score on the subsection is 144 and that the standard deviation of their scores is 22. Based on this information, complete the parts below. (a) What are the null hypothesis H, and the alternative hypothesis H, that should be used for the test? H X H : 0 020 0=0 0#0 (b) Suppose that you decide to reject the null hypothesis. What sort of error might you be making? (Choose one) X (c) Suppose the true mean score among the general population on the subsection is 148. Fill in the blanks to describe a Type I error. A Type I error would be (Choose one) the hypothesis that u is (Choose one) (Choose one) when, in fact, u is (Cho rejecting failing to rejectEI H1 :[ | l2_ =_ EI (b) Suppose that you de'- - > - ' - . hypothesis. What sort of error might you be making? equal to 22 (Choose one) V equal to 148 X 3 less than 22 ' less than 144 less than 148 A Type I error W0\" greater than 148 when, in fact, [1 is (Choose one) (c) Suppose the true m eneral population on the subsection is 148. Fill in the blanks to describe a Type I error. 3 the hypothesis that u is |(Choose one) V \"(Choose one) V ' V EI H1 : :I 2 =|:| :2 (b) Suppose that you decide to reject the null hypothesis. What sort of error might you be making? (Choose one) V X f) Espaol 20
Step by Step Solution
There are 3 Steps involved in it

Get step-by-step solutions from verified subject matter experts