

Question: 11 Be knowledgeable The following information was provided by David, a candle producer, based on his monthly production and sales. Table 3.3.1 Tota Fored Variable
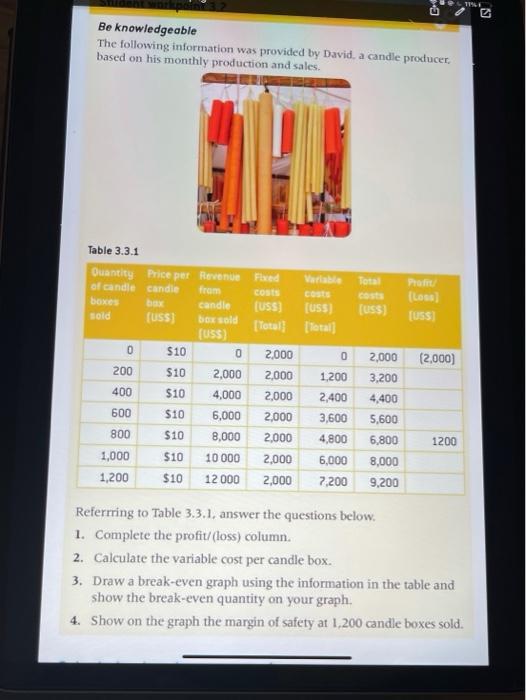
11 Be knowledgeable The following information was provided by David, a candle producer, based on his monthly production and sales. Table 3.3.1 Tota Fored Variable COST coats (USS) [uss) Total Total] Profit (Loss) (USS) (USS) 0 0 2,000 (2,000) Quantity Price per Revenue of candle candle from boxe candle sold (USS) Do sold (USS) $10 0 200 $10 2,000 $10 4,000 600 $10 6,000 800 $10 8,000 1,000 $10 10 000 1,200 $10 12000 400 2,000 2,000 2,000 2,000 2,000 2,000 2,000 1,200 3,200 2,400 4,400 3,600 5,600 4,800 6,800 6,000 8,000 7,200 9,200 1200 Referring to Table 3.3.1, answer the questions below. 1. Complete the profit/(loss) column. 2. Calculate the variable cost per candle box. 3. Draw a break-even graph using the information in the table and show the break-even quantity on your graph. 4. Show on the graph the margin of safety at 1,200 candle boxes sold
Step by Step Solution
There are 3 Steps involved in it

Get step-by-step solutions from verified subject matter experts