

Question: 11. Calculate the r 2 effect size given the SPSS output as shown in this module's presentation. Show all of your work. Interpret it as
11. Calculate the r2effect size given the SPSS output as shown in this module's presentation. Show all of your work. Interpret it as "small", "medium" or "large".
12. What is the tobtained from your SPSS output? Using your table in the Appendix of your e-book, determine the critical tvalue for this study. Clearly identify the tobtained and the t critical values below. Describe how the critical value can be used to determine whether a tobtained value will result in a rejection of the null hypothesis (i.e. that it is significant).
Group Statistics | |||||
groups | N | Mean | Std. Deviation | Std. Error Mean | |
data | 1.00 | 7 | 9.8571 | 1.95180 | .73771 |
2.00 | 7 | 14.2857 | 2.56348 | .96890 |
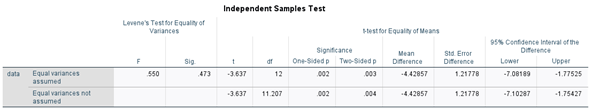
Independent Samples Test Levine's Test for Equality of Variances +best for Equality of Me mag 95% Confidence Interval of the Significance Mean Sid Error F Sip One-Sided p Two-Sided p Difference Lower Upper Equal variances 550 473 3.837 12 802 -4,42857 1.21778 -708189 -1,77535 assumed Equal variances not 3.637 11.207 .802 .4.42857 1.21778 -T_10187 1.75427 assumed
Step by Step Solution
There are 3 Steps involved in it

Get step-by-step solutions from verified subject matter experts