

Question: 11. Complete the financial ratio analysis within the excel files (green.tab). What do these ratios reveal? Q42012Q32012Q22012Q12012Q42011Q32011Q22011Q12011 Leverage Ratios Debvequity Dobt/Capital (Book) DebtCapital (Mkt Cap)
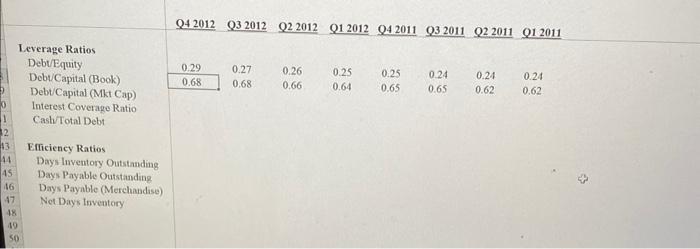
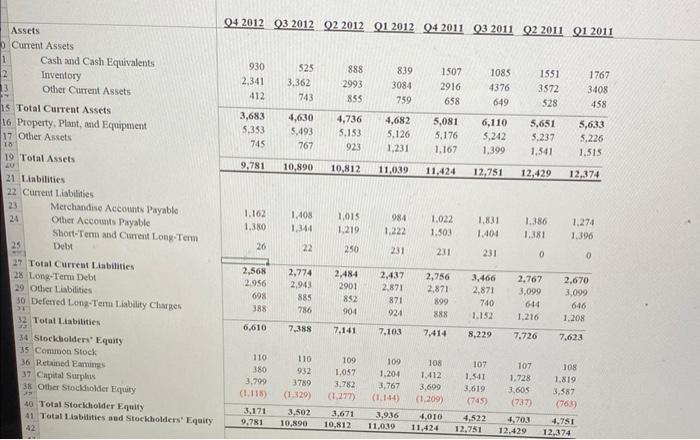
11. Complete the financial ratio analysis within the excel files (green.tab). What do these ratios reveal? Q42012Q32012Q22012Q12012Q42011Q32011Q22011Q12011 Leverage Ratios Debvequity Dobt/Capital (Book) DebtCapital (Mkt Cap) \begin{tabular}{|llllllll|} \hline 0.29 & 0.27 & 0.26 & 0.25 & 0.25 & 0.24 & 0.24 & 0.24 \\ \hline 0.68 & 0.68 & 0.66 & 0.64 & 0.65 & 0.65 & 0.62 & 0.62 \\ \hline \end{tabular} Interest Coverago Ratio CastuTotal Debi Efficiency Ratios Days luventory Outstanding Days Payable Outstanding Days Payable (Merchandise) Net Days tnventory Assets Current Assets Cash and Cash Equivalents Inventory Other Current Assets Total Current Assets 16 Property, Plant, and Equipment Other Assets 19 Total Assets 21 L.iabilities \begin{tabular}{|rrrrrrrr|} \hline 930 & 525 & 888 & 839 & 1507 & 1085 & 1551 & 1767 \\ \hline 2,341 & 3,362 & 2993 & 3084 & 2916 & 4376 & 3572 & 3408 \\ 412 & 743 & 855 & 759 & 658 & 649 & 528 & 458 \\ \hline 3,683 & 4,630 & 4,736 & 4,682 & 5,081 & 6,110 & 5,651 & 5,633 \\ 5,353 & 5,493 & 5,153 & 5,126 & 5,176 & 5,242 & 5,237 & 5,226 \\ 745 & 767 & 923 & 1,231 & 1,167 & 1,399 & 1,541 & 1,515 \\ \hline 9,781 & 10,890 & 10,812 & 11,039 & 11,424 & 12,751 & 12,429 & 12,374 \\ \hline & & & & & & \\ \hline \end{tabular} Current Liabilitics 11. Complete the financial ratio analysis within the excel files (green.tab). What do these ratios reveal? Q42012Q32012Q22012Q12012Q42011Q32011Q22011Q12011 Leverage Ratios Debvequity Dobt/Capital (Book) DebtCapital (Mkt Cap) \begin{tabular}{|llllllll|} \hline 0.29 & 0.27 & 0.26 & 0.25 & 0.25 & 0.24 & 0.24 & 0.24 \\ \hline 0.68 & 0.68 & 0.66 & 0.64 & 0.65 & 0.65 & 0.62 & 0.62 \\ \hline \end{tabular} Interest Coverago Ratio CastuTotal Debi Efficiency Ratios Days luventory Outstanding Days Payable Outstanding Days Payable (Merchandise) Net Days tnventory Assets Current Assets Cash and Cash Equivalents Inventory Other Current Assets Total Current Assets 16 Property, Plant, and Equipment Other Assets 19 Total Assets 21 L.iabilities \begin{tabular}{|rrrrrrrr|} \hline 930 & 525 & 888 & 839 & 1507 & 1085 & 1551 & 1767 \\ \hline 2,341 & 3,362 & 2993 & 3084 & 2916 & 4376 & 3572 & 3408 \\ 412 & 743 & 855 & 759 & 658 & 649 & 528 & 458 \\ \hline 3,683 & 4,630 & 4,736 & 4,682 & 5,081 & 6,110 & 5,651 & 5,633 \\ 5,353 & 5,493 & 5,153 & 5,126 & 5,176 & 5,242 & 5,237 & 5,226 \\ 745 & 767 & 923 & 1,231 & 1,167 & 1,399 & 1,541 & 1,515 \\ \hline 9,781 & 10,890 & 10,812 & 11,039 & 11,424 & 12,751 & 12,429 & 12,374 \\ \hline & & & & & & \\ \hline \end{tabular} Current Liabilitics
Step by Step Solution
There are 3 Steps involved in it

Get step-by-step solutions from verified subject matter experts