

Question: 11. Create a scatterplot for the data in the LDL and White Scatter Plot (n=300) columns . Paste it here . 14- 12- 10 WHITE

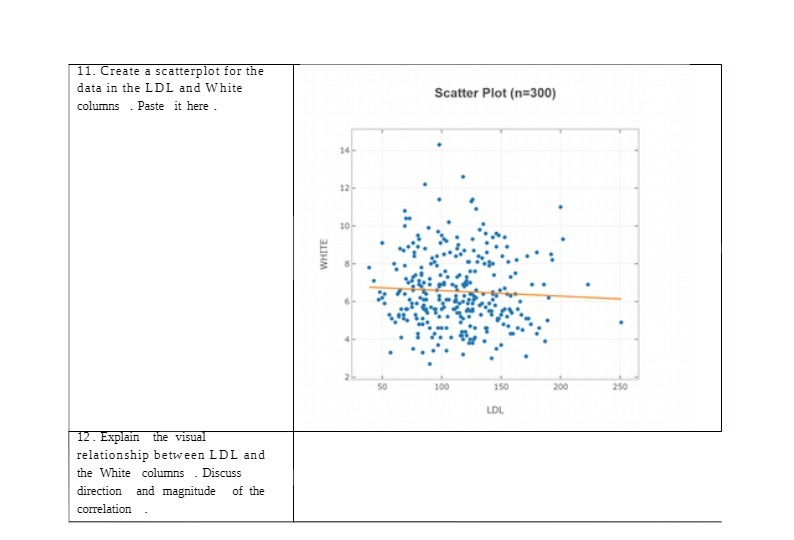
11. Create a scatterplot for the data in the LDL and White Scatter Plot (n=300) columns . Paste it here . 14- 12- 10 WHITE 50 100 150 200 250 LDL 12 . Explain the visual relationship between LDL and the White columns . Discuss direction and magnitude of the correlation
Step by Step Solution
There are 3 Steps involved in it
1 Expert Approved Answer
Step: 1 Unlock

Question Has Been Solved by an Expert!
Get step-by-step solutions from verified subject matter experts
Step: 2 Unlock
Step: 3 Unlock