

Question: 11 In a statistics class, 10 scores were randomly selected with the following results (mean = 71.5): d 74, 73, 77, 77, 71, 68, 65,


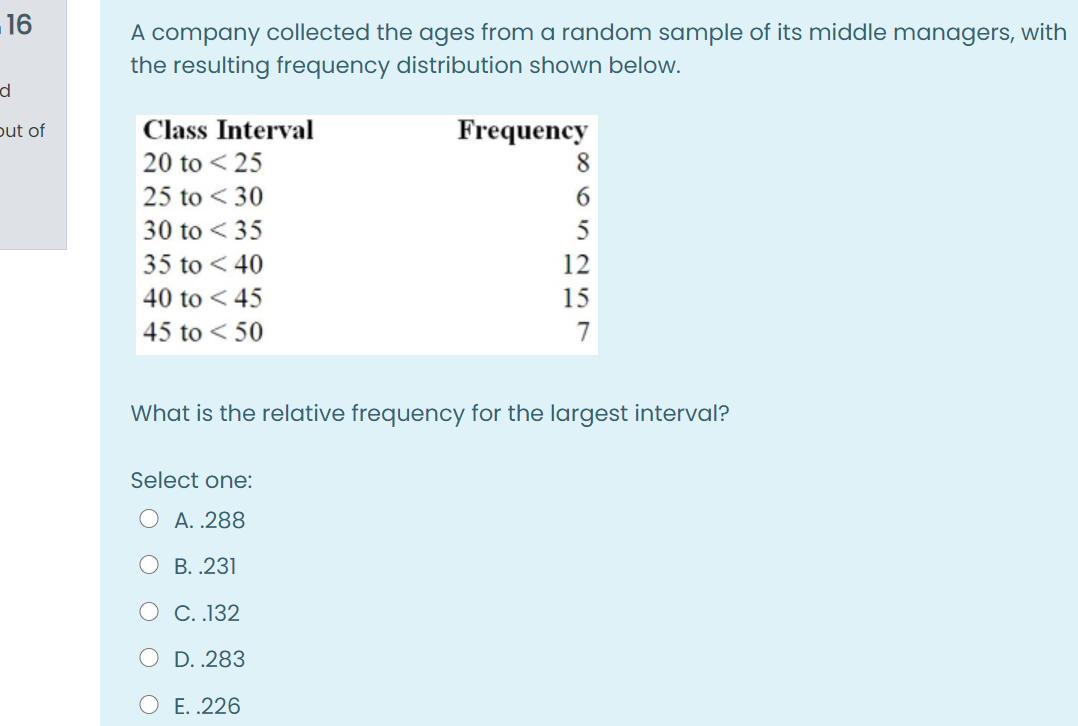


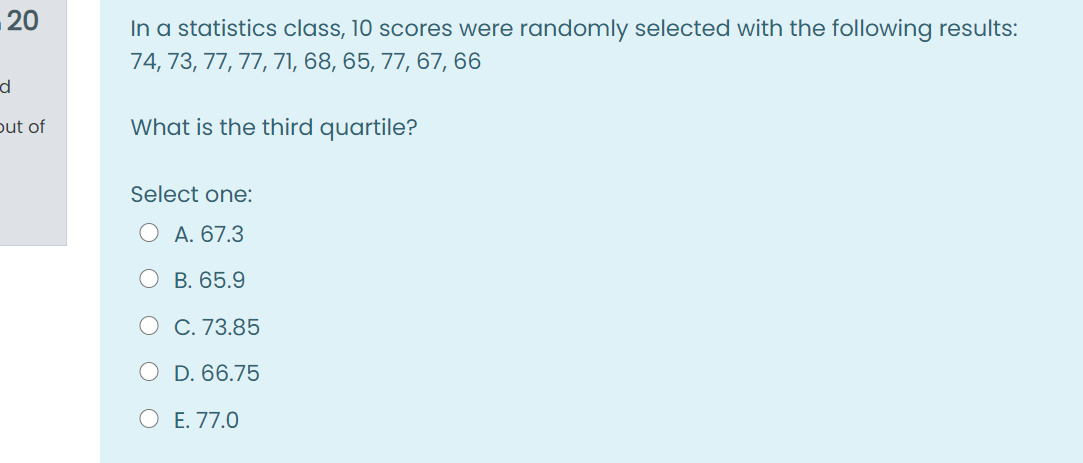
11 In a statistics class, 10 scores were randomly selected with the following results (mean = 71.5): d 74, 73, 77, 77, 71, 68, 65, 77, 67, 66 out of What is the standard deviation? Select one: O A. 22.72 O B. 144.00 O C. 4.77 O D. 12.00 O E. 516.20Which of the following is a quantitative variable? Select one: Q A. A person's gender O B. Whether a person is a college graduate O C. Whether a person has a charge account O D. Mileage of a car O E. The manufacturer of a cell phone 13 The average life of Canadian women is 73.75 years, and the standard deviation of the life expectancy of Canadian women is 6.5 years. Using Chebyshev's Theorem, d determine the minimum percentage of women in Canada whose life expectancy is out of between 64 and 83.5 years. Select one: O A. 33.33% O B. 88.89% O C. 55.56% O D. 93.17% O E. 68.26%14 The local amusement park was interested in the average wait time at their most popular roller coaster at the peak park time (2 p.m.). They selected 13 patrons and d had them get in line between 2 and 3 p.m. Each was given a stopwatch to record the out of time they spent in line. The times recorded were as follows (in minutes; mean = 114.15): 118, 124, 108, 116, 99, 120, 148, 118, 119, 121, 45, 130, 118. What is the range? Select one: O A. 128.8 O B. 23.62 O C. 115 O D. 103 O E. 557.9715 In a statistics class, the following 10 scores were randomly selected: 74, 73, 77, 77, 71, 68, 65, 77, 67, 66. ut of What is the median? Select one: O A. 77.0 O B. 72.0 O C. 71.5 O D. 73.0 O E. 71.016 A company collected the ages from a random sample of its middle managers, with the resulting frequency distribution shown below. d out of Class Interval Frequency 20 to
Step by Step Solution
There are 3 Steps involved in it

Get step-by-step solutions from verified subject matter experts