

Question: 11 Parameter Filters Imagine we have a parameter called SelectedDate that enables the user to select a specific date. Our chart plots Date on the
![chosen date? [Date] = [SelectedDate] MAX([Date]) = [SelectedDate] = [SelectedDate] = TRUE](https://s3.amazonaws.com/si.experts.images/answers/2024/09/66dbc48c72d57_73266dbc48c0d995.jpg)
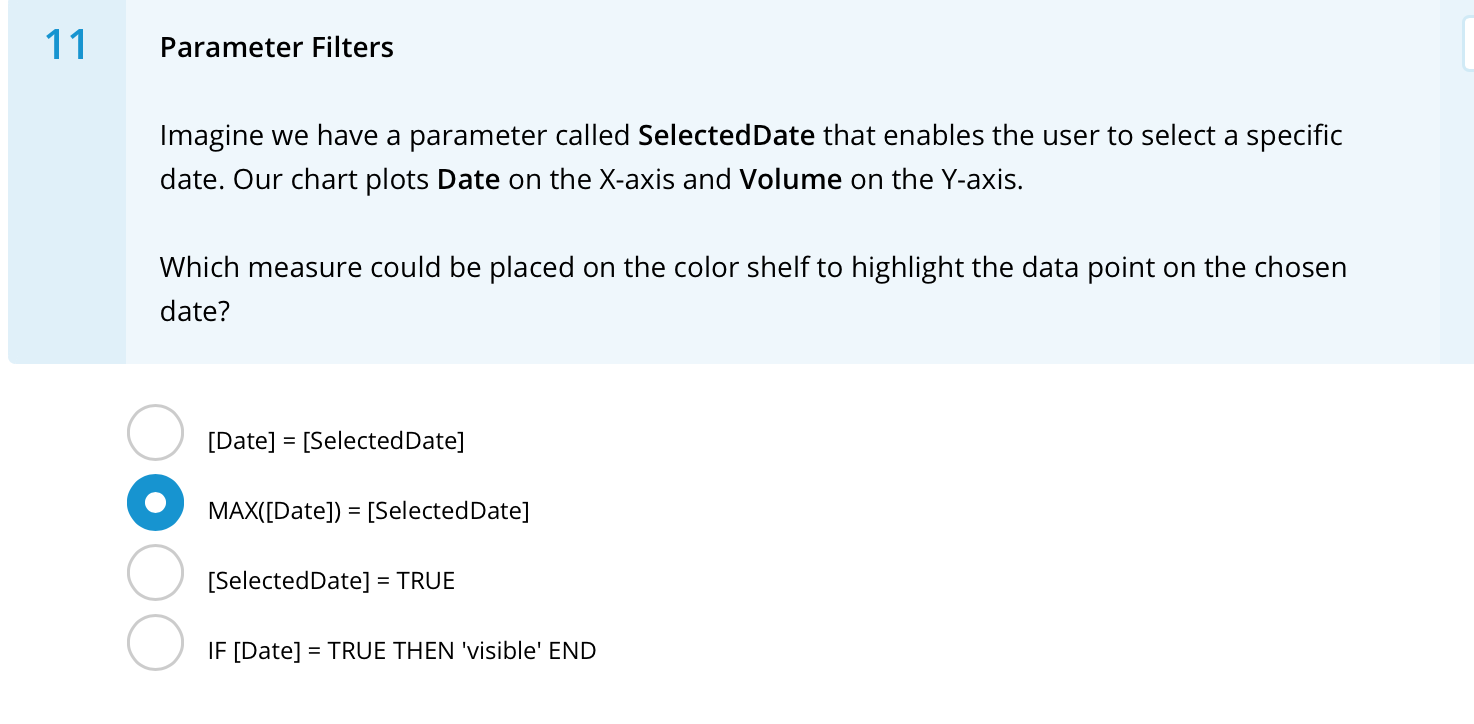
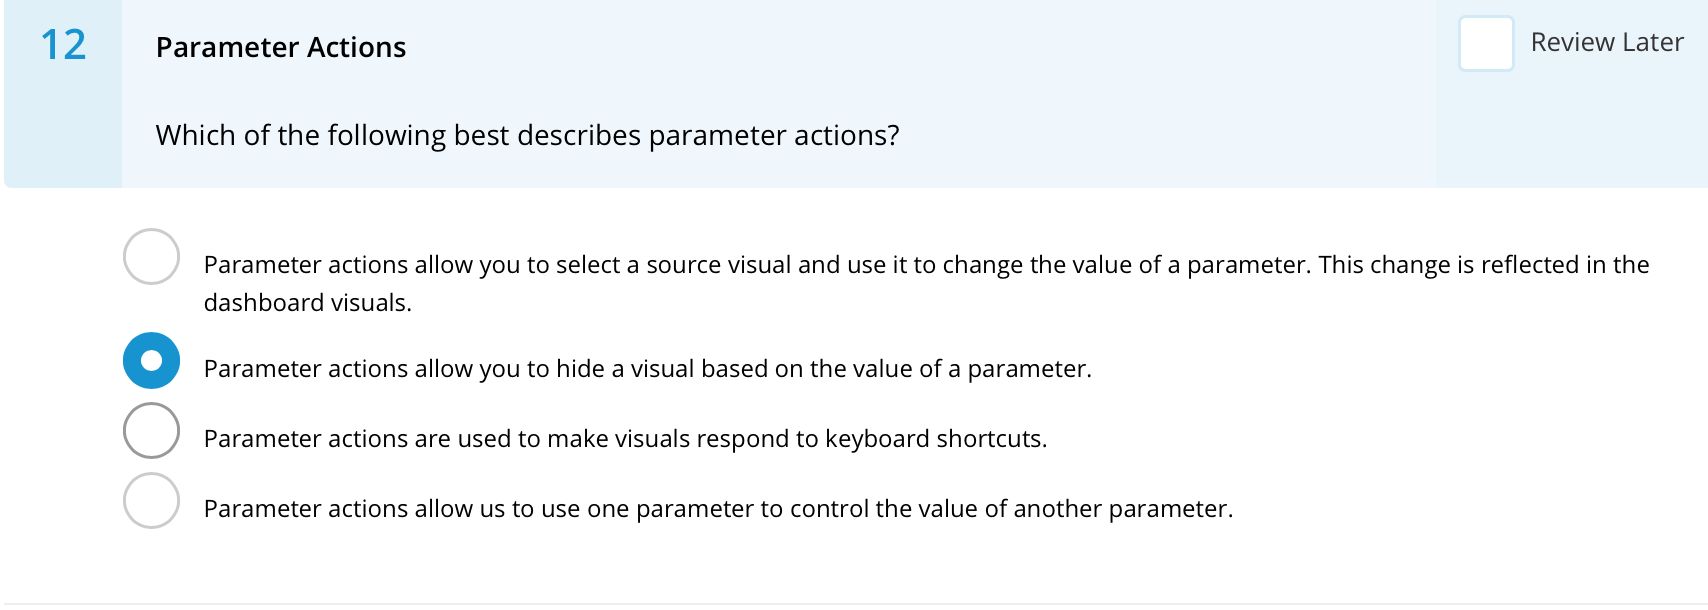
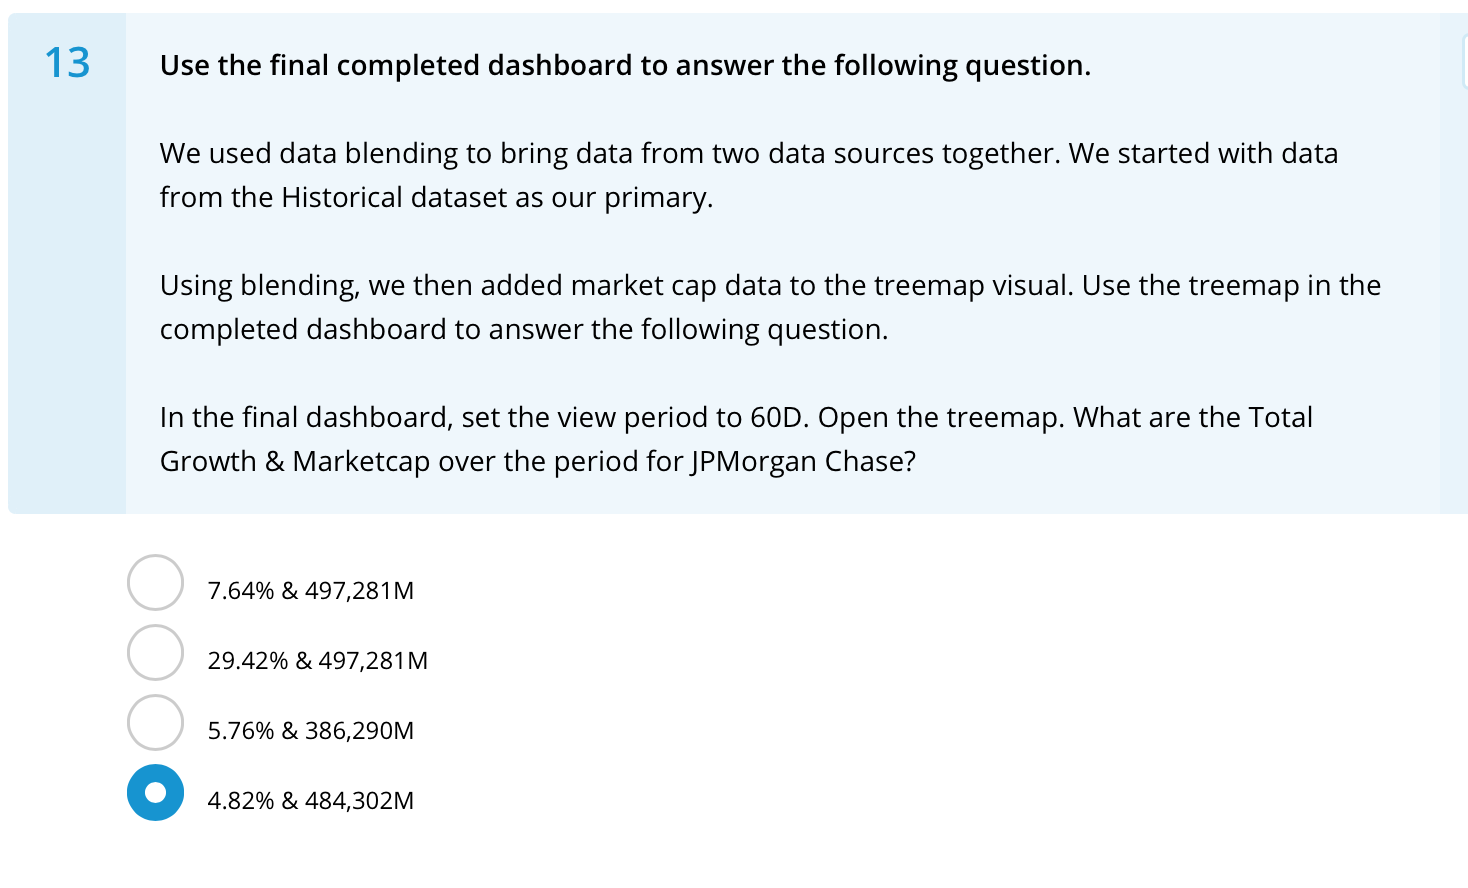
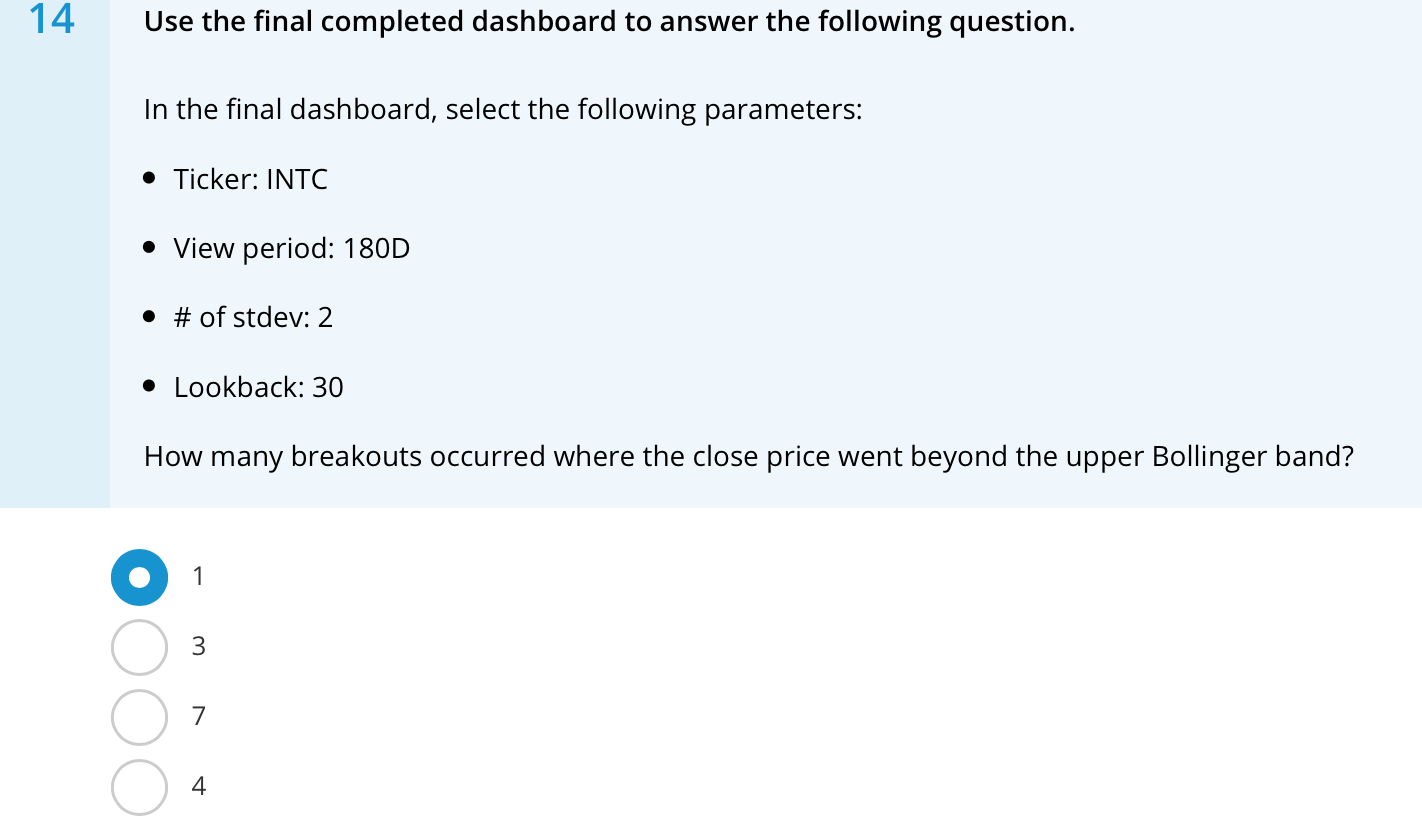
11 Parameter Filters Imagine we have a parameter called SelectedDate that enables the user to select a specific date. Our chart plots Date on the X-axis and Volume on the Y-axis. Which measure could be placed on the color shelf to highlight the data point on the chosen date? [Date] = [SelectedDate] MAX([Date]) = [SelectedDate] = [SelectedDate] = TRUE IF [Date] = TRUE THEN 'visible' END 12 Parameter Actions Review Later Which of the following best describes parameter actions? Parameter actions allow you to select a source visual and use it to change the value of a parameter. This change is reflected in the dashboard visuals. Parameter actions allow you to hide a visual based on the value of a parameter. Parameter actions are used to make visuals respond to keyboard shortcuts. Parameter actions allow us to use one parameter to control the value of another parameter. 13 Use the final completed dashboard to answer the following question. We used data blending to bring data from two data sources together. We started with data from the Historical dataset as our primary. Using blending, we then added market cap data to the treemap visual. Use the treemap in the completed dashboard to answer the following question. In the final dashboard, set the view period to 60D. Open the treemap. What are the Total Growth & Marketcap over the period for JPMorgan Chase? 7.64% & 497,281M 29.42% & 497,281M 5.76% & 386,290M 4.82% & 484,302M 14 Use the final completed dashboard to answer the following question. In the final dashboard, select the following parameters: Ticker: INTC View period: 180D # of stdev: 2 Lookback: 30 How many breakouts occurred where the close price went beyond the upper Bollinger band? 1 3 7 4 15 Use the final completed dashboard to answer the following question. In the final dashboard select the following parameters Ticker: UNH View Period: 7D Lookback: 20 days What was the moving average on the first date in the window? 407.64 410.81 400.74 392.96
Step by Step Solution
There are 3 Steps involved in it

Get step-by-step solutions from verified subject matter experts