

Question: 11) Paste an appropriate SPSS graph (make sure you use the procedures outlined in this module's SPSS video- and don't forget to label your y


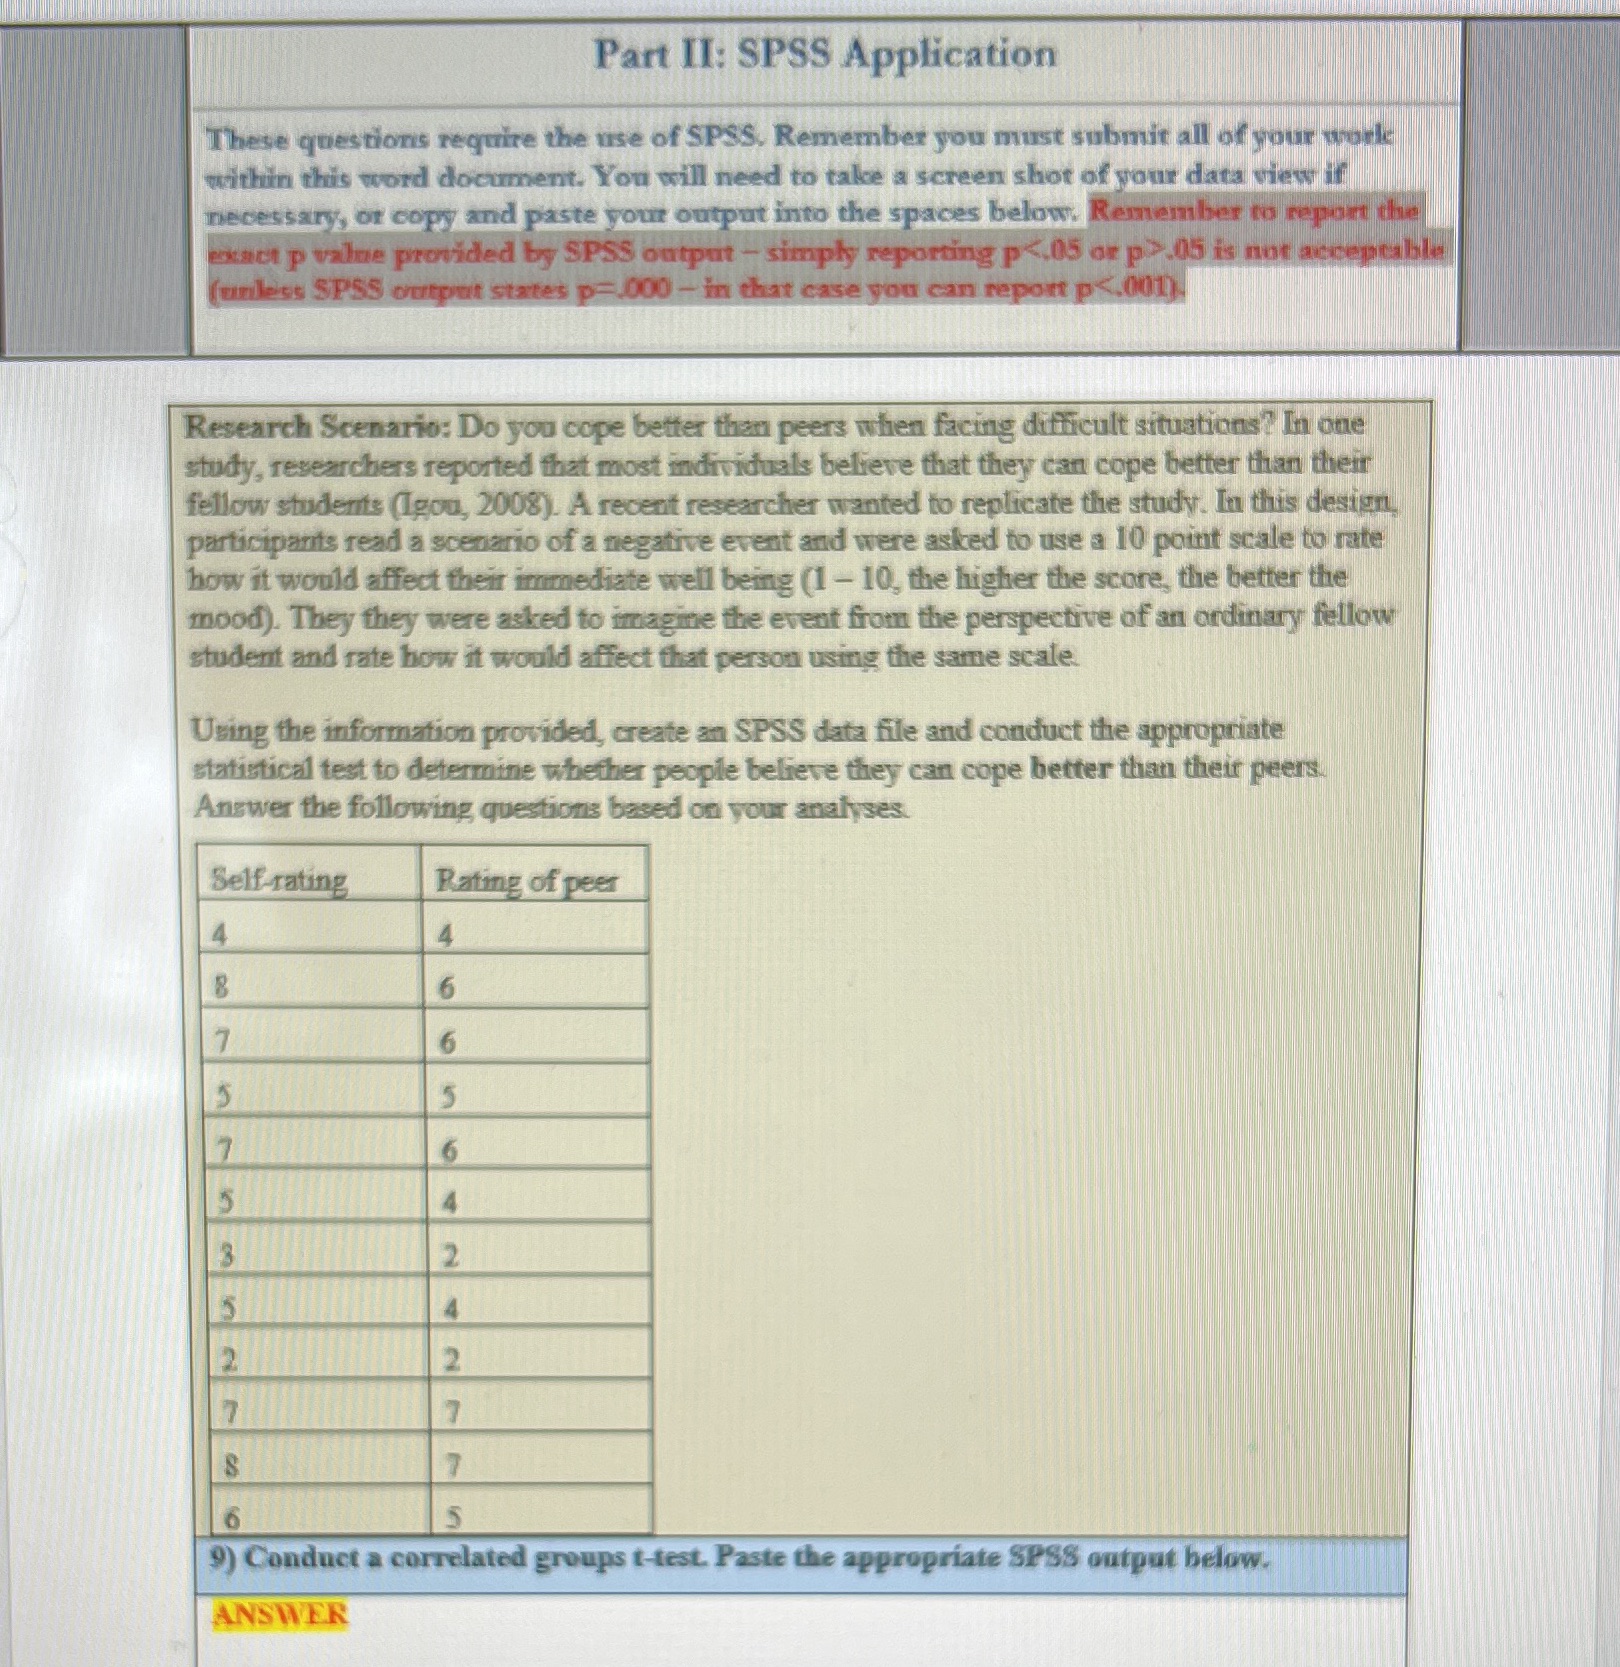
11) Paste an appropriate SPSS graph (make sure you use the procedures outlined in this module's SPSS video- and don't forget to label your y axis "Coping Ability". ANSWER 12) Write an APA-style Results section based on your analyses. All homework "Results sections" should follow the examples provided in the videos. Don't forget to include the effect size, confidence interval, and a decision about the null hypothesis. If significant, make sure you interpret how the conditions differ (refer to the Figure or report the means and standard deviations). ANSWERPart II: SPSS Application These questions require the use of SPSS. Remember you must submit all of your work within this word document. You will need to take a screen shot of your data views if necessary, or copy and paste your output into the spaces below. Remember to report the exact p value provided by SPSS output - simply reporting p<.05 or p>.05 is not acceptable (unless SPSS output states p=.000 - in that case you can report p<.001 research scenario: do you cope better than peers when facing difficult situations in one study researchers reported that most individuals believe they can their fellow students a recent researcher wanted to replicate the study. this design. participants read scenario of negative event and were asked use point scale rate how it would affect immediate well being higher score mood imagine from perspective an ordinary student person using same scale. information provided create spss data file conduct appropriate statistical test determine whether people peers. answer following questions based on your analyses. self-rating rating peer correlated groups t-test. paste output below>
Step by Step Solution
There are 3 Steps involved in it

Get step-by-step solutions from verified subject matter experts