

Question: 11 . Show what happens on each graph when the central bank uses monetary policy to close the gap Nominal Money Market Nominal Investment Demand
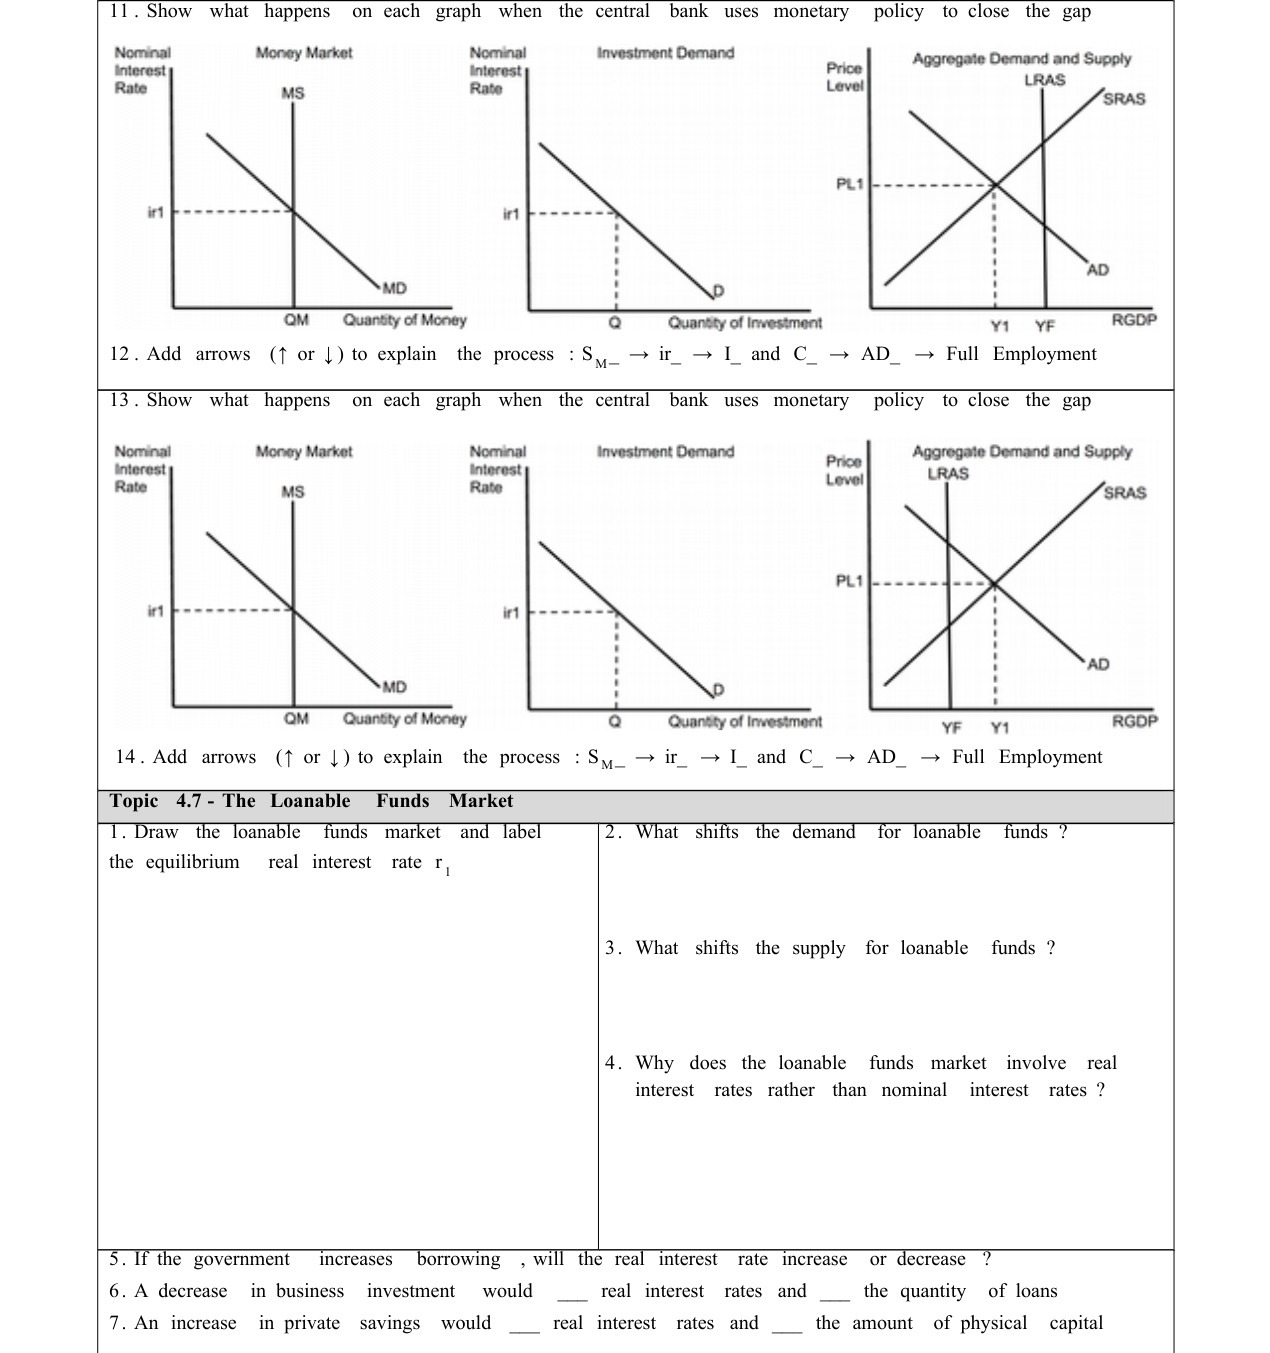

11 . Show what happens on each graph when the central bank uses monetary policy to close the gap Nominal Money Market Nominal Investment Demand Aggregate Demand and Supply Interest Interest Price Rate MS Rate Level LRAS SRAS PL1 in1 in1 MD OM Quantity of Money Quantity of Investment Y1 YF RGDP 12 . Add arrows (1 or ) ) to explain the process : S _- ir_- I and C_ - AD_- Full Employment 13 . Show what happens on each graph when the central bank uses monetary policy to close the gap Nominal Money Market Nominal Investment Demand Interest Interest Rate MS Rate ir1 if1 MD OM Quantity of Money Quantity of Investment YF Y1 RGDP 14. Add arrows (1 or ) ) to explain the process : SM_- ir_ - I_and C_ - AD_- Full Employment Topic 4.7 - The Loanable Funds Market 1. Draw the loanable funds market and label 2. What shifts the demand for loanable funds ? the equilibrium real interest rate , 3. What shifts the supply for loanable funds ? 4. Why does the loanable funds market involve real interest rates rather than nominal interest rates ? 5. If the government increases borrowing , will the real interest rate increase or decrease 6. A decrease in business investment would real interest rates and the quantity of loans 7. An increase in private savings w real interest rates and the amount of physical capital
Step by Step Solution
There are 3 Steps involved in it

Get step-by-step solutions from verified subject matter experts