

Question: 11 The graph below shows the weekly demand for bathing suits at a resort town in North Carolina. (D Demand for Bathing Suits 80 70
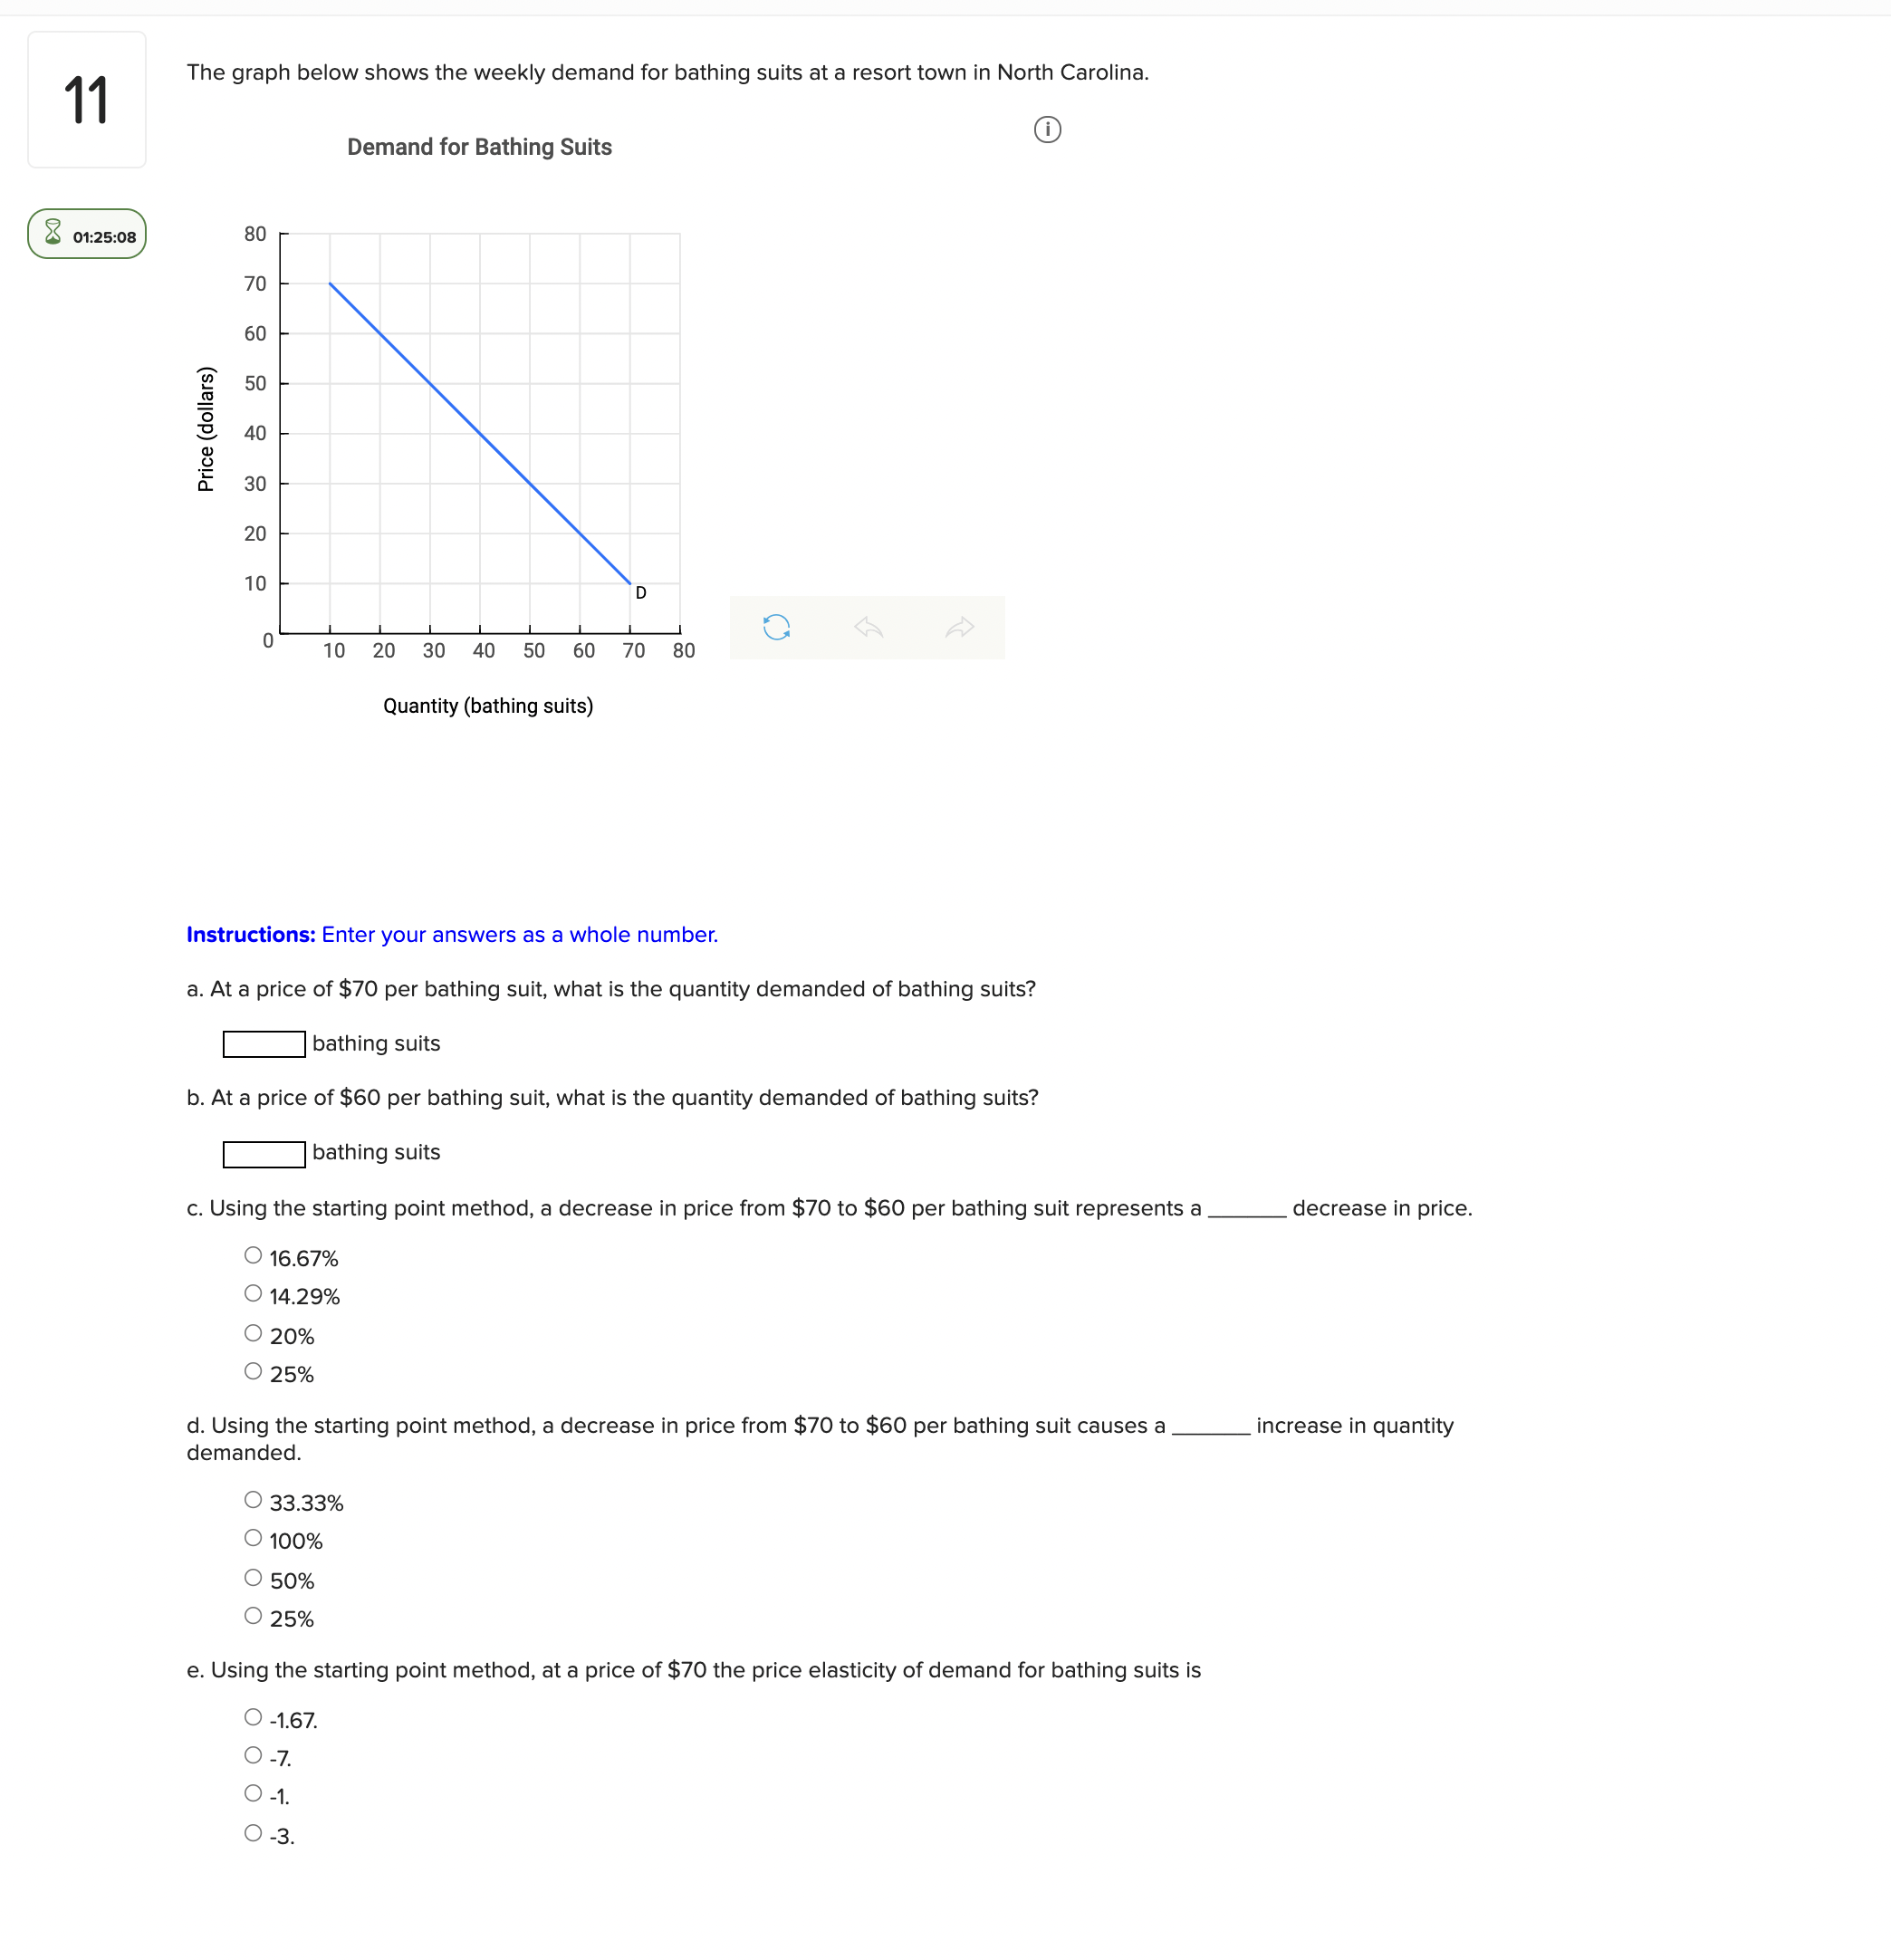

11 The graph below shows the weekly demand for bathing suits at a resort town in North Carolina. (D Demand for Bathing Suits 80 70 60 50 40 Price (dollars) 30 20 10 Q 10 20 30 40 50 60 70 80 Quantity (bathing suits) Instructions: Enter your answers as a whole number. a. At a price of $70 per bathing suit, what is the quantity demanded of bathing suits? bathing suits b. At a price of $60 per bathing suit, what is the quantity demanded of bathing suits? bathing suits c. Using the starting point method, a decrease in price from $70 to $60 per bathing suit represents a decrease in price. O 16.67% 0 14.29% 0 20% O 25% d. Using the starting point method, a decrease in price from $70 to $60 per bathing suit causes a demanded. increase in quantity O 33.33% 0 100% O 50% O 25% e. Using the starting point method, at a price of $70 the price elasticity of demand for bathing suits is O -1.67. O -7. O -1. O -3
Step by Step Solution
There are 3 Steps involved in it

Get step-by-step solutions from verified subject matter experts