

Question: (1.1) Using your table of values create a plot of i) P vs U, ii) P vs U2 and iii) 1/Q vs U2. (3 marks).
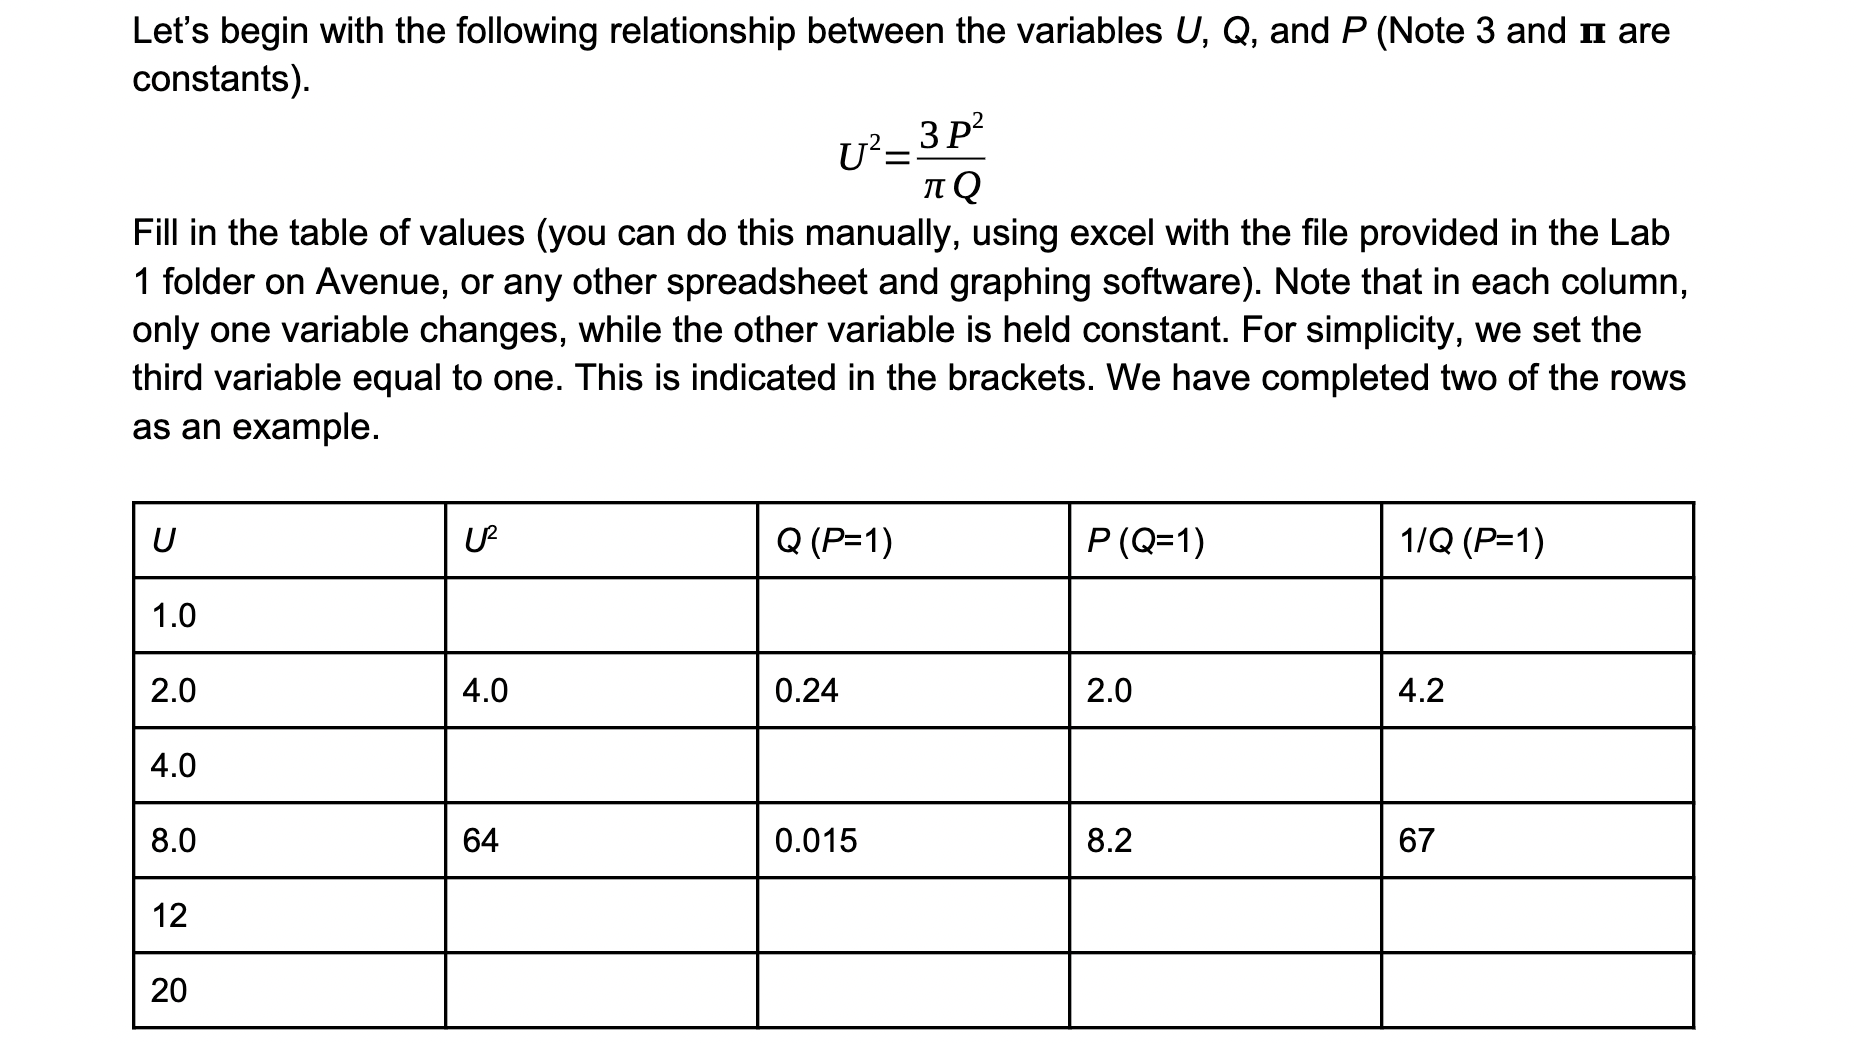
(1.1) Using your table of values create a plot of i) P vs U, ii) P vs U2 and iii) 1/Q vs U2. (3 marks). When we say (something) vs (something), this means y (vertical) vs x (horizontal). Note that you can create these plots using whichever method you prefer. Graphing software or hand drawn graphs on graph paper are acceptable, make sure to look at the lab intro document on avenue to remind yourself what we are looking for in submitted graphs. Do not connect your data points, label your axis. + Drag and drop an image or PDF file or click to browse... 1.2 (3 points) (1.2) i) Which plot(s) from 1.1 are linear? ii) How could you tell without graphing? Discuss this in a few sentences using the word "proportional". iii) If U is held constant (i.e. U = 1), what graphing relationship between P and 0 would yield a straight line (i.e the graph would be linear)? Let's begin with the following relationship between the variables U, Q, and P (Note 3 and II are constants). 3 P2 7: Q Fill in the table of values (you can do this manually, using excel with the le provided in the Lab 1 folder on Avenue, or any other spreadsheet and graphing software). Note that in each column, only one variable changes, while the other variable is held constant. For simplicity, we set the third variable equal to one. This is indicated in the brackets. We have completed two of the rows as an example. U2
Step by Step Solution
There are 3 Steps involved in it

Get step-by-step solutions from verified subject matter experts