

Question: 1.(10) Defect level and fault coverage. Show that for a clustered fault distribution, if the required defect level is DL, then the fault coverage
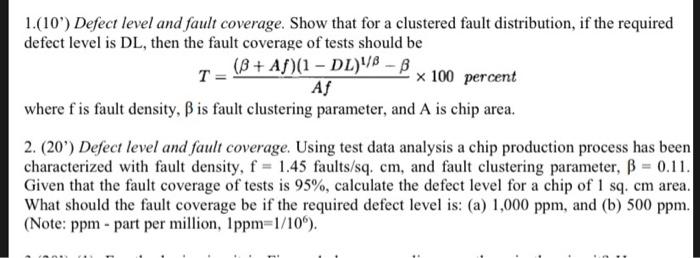
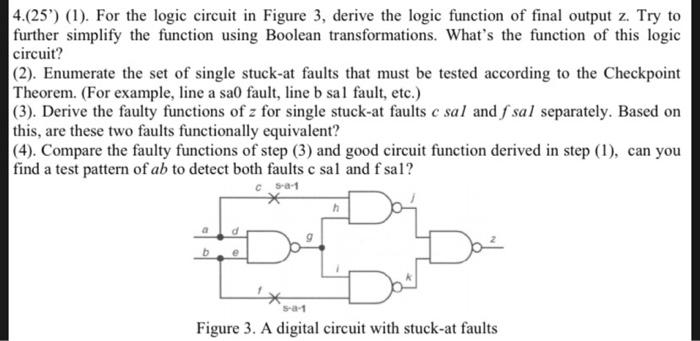
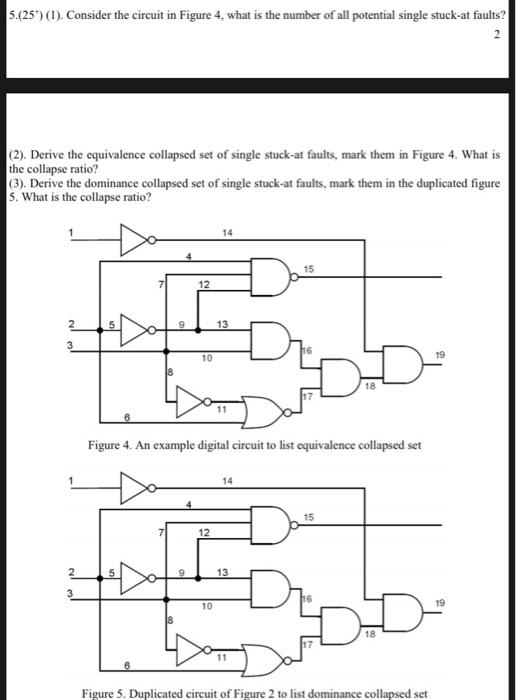
1.(10) Defect level and fault coverage. Show that for a clustered fault distribution, if the required defect level is DL, then the fault coverage of tests should be T (B+ Af)(1-DL)VB-B Af x 100 percent where fis fault density, is fault clustering parameter, and A is chip area. 2. (20) Defect level and fault coverage. Using test data analysis a chip production process has been characterized with fault density, f = 1.45 faults/sq. cm, and fault clustering parameter, = 0.11. Given that the fault coverage of tests is 95%, calculate the defect level for a chip of 1 sq. cm area. What should the fault coverage be if the required defect level is: (a) 1,000 ppm, and (b) 500 ppm. (Note: ppm - part per million, 1ppm=1/10%). MI T 4.(25') (1). For the logic circuit in Figure 3, derive the logic function of final output z. Try to further simplify the function using Boolean transformations. What's the function of this logic circuit? (2). Enumerate the set of single stuck-at faults that must be tested according to the Checkpoint Theorem. (For example, line a sa0 fault, line b sal fault, etc.) (3). Derive the faulty functions of z for single stuck-at faults c sal and f sal separately. Based on this, are these two faults functionally equivalent? (4). Compare the faulty functions of step (3) and good circuit function derived in step (1), can you find a test pattern of ab to detect both faults c sal and f sal? C 5-a-1 h b e Figure 3. A digital circuit with stuck-at faults 5.(25") (1). Consider the circuit in Figure 4, what is the number of all potential single stuck-at faults? (2). Derive the equivalence collapsed set of single stuck-at faults, mark them in Figure 4. What is the collapse ratio? (3). Derive the dominance collapsed set of single stuck-at faults, mark them in the duplicated figure 5. What is the collapse ratio? 14 15 12 2 5 3 10 19 18 18 Figure 4. An example digital circuit to list equivalence collapsed set 14 15 3 Dr. 19 18 11 Figure 5. Duplicated circuit of Figure 2 to list dominance collapsed set 9 9 12 10 13 13
Step by Step Solution
3.51 Rating (154 Votes )
There are 3 Steps involved in it
The derivation and solution of th... View full answer

Get step-by-step solutions from verified subject matter experts