

Question: 11.1 Excel Activity 2a - Confidence Intervals for Variance and Standard Deviation (Structured) See attached for data The table showing the stock price changes for

11.1 Excel Activity 2a - Confidence Intervals for Variance and Standard Deviation (Structured)
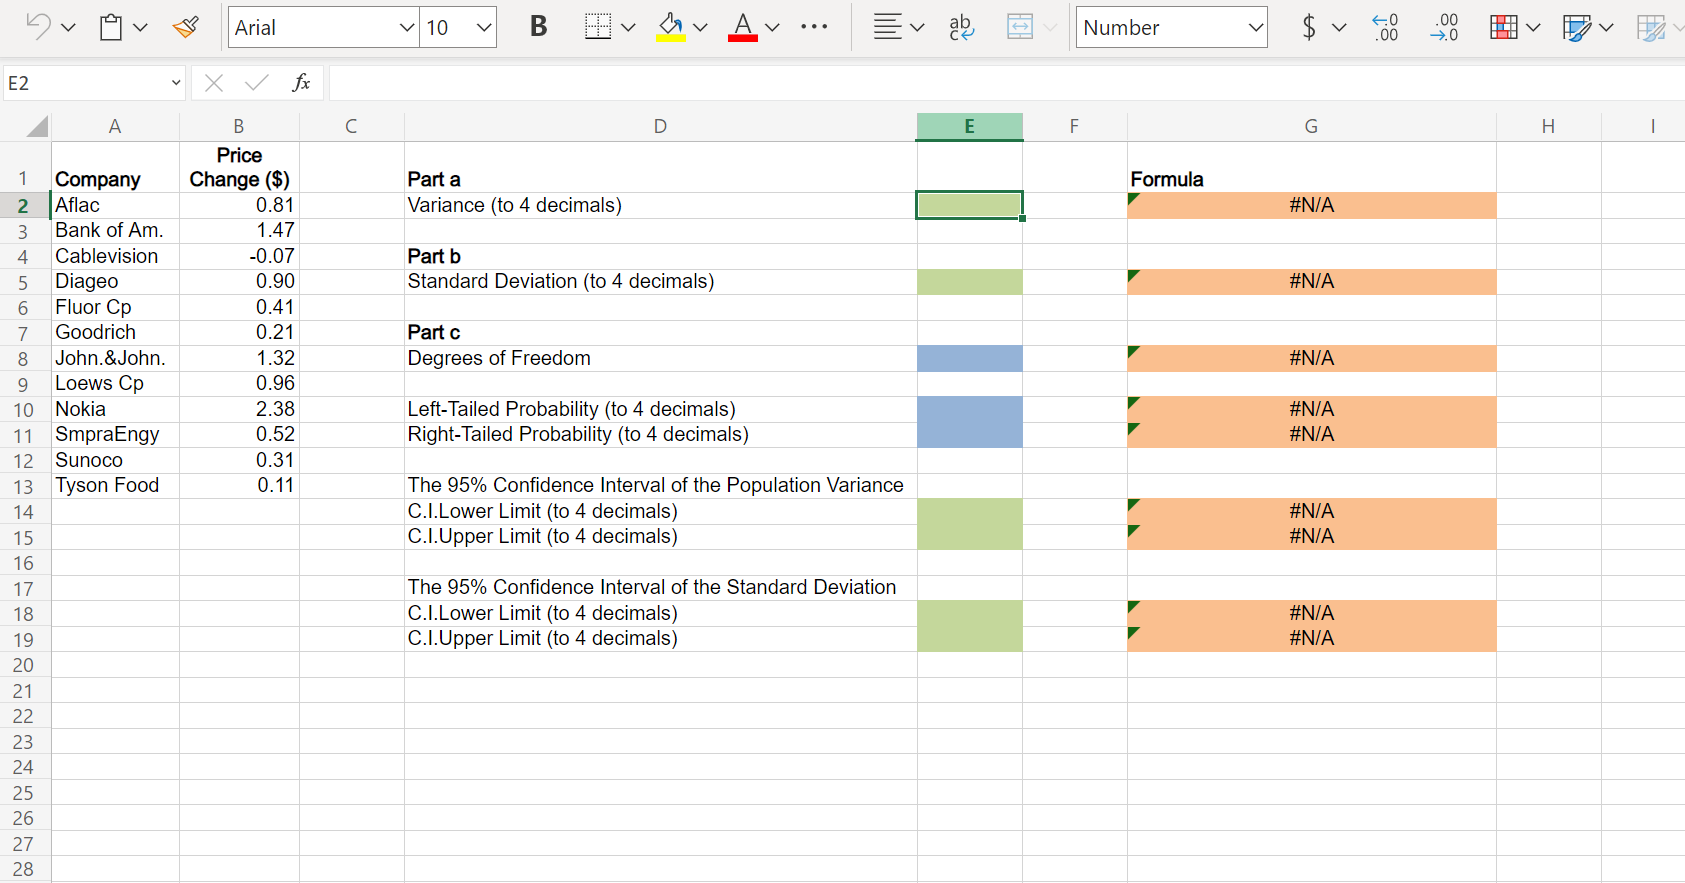
See attached for data
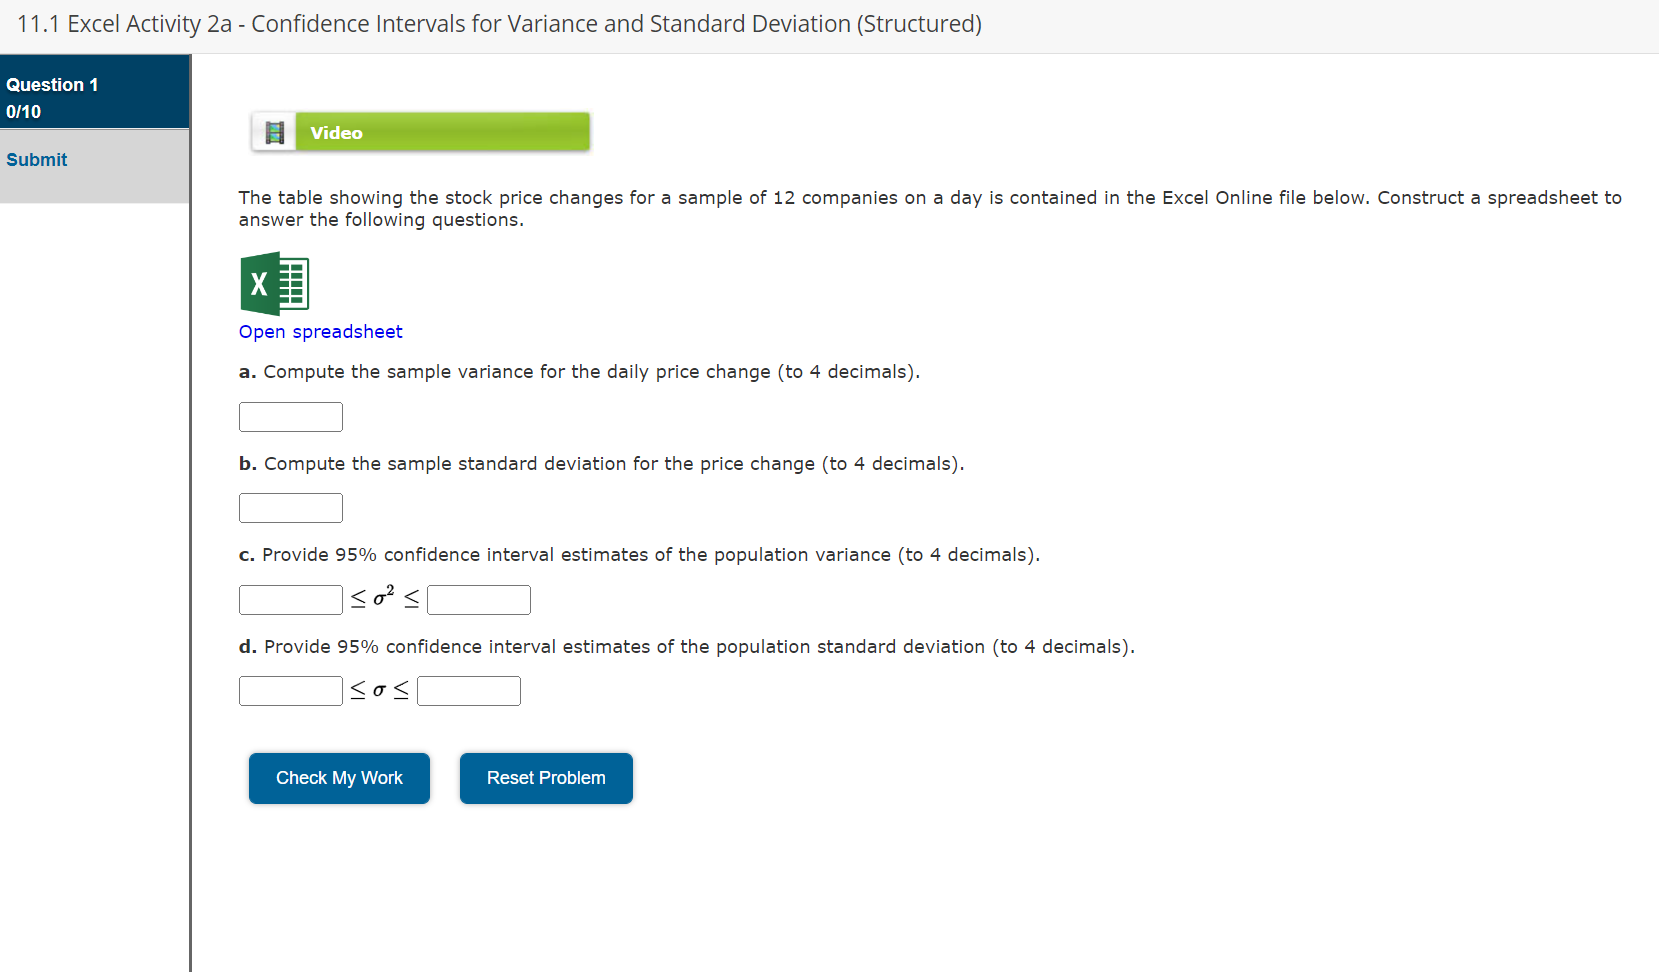
The table showing the stock price changes for a sample of 12 companies on a day is contained in the Excel Online file below. Construct a spreadsheet to answer the following questions.

11.1 Excel Activity 2a - Condence Intervals for Variance and Standard Deviation (Structured) Question 1 0110 The table showing the stock price changes for a sample of 12 companies on a clay is contained in the Excel Online file below. Construct a spreadsheet to answer the following questions. XE Open spreadsheet Submit a. Compute the sample variance for the daily price change (to 4 decimals). :i b. Compute the sample standard deviation for the price change (to 4 decimals). :i c. Provide 95% condence interval estimates of the population variance (to 4 decimals). ESU'SE d. Provide 95% condence interval estimates of the population standard deviation (to 4 decimals). :iSUSCI Check My Work Reset Problem
Step by Step Solution
There are 3 Steps involved in it

Get step-by-step solutions from verified subject matter experts