

Question: 1.1dentify, which graphical displayand the statistical procedure that might be appropriate in each case. Investigate the percentage of smokers in your community __________ Compare the
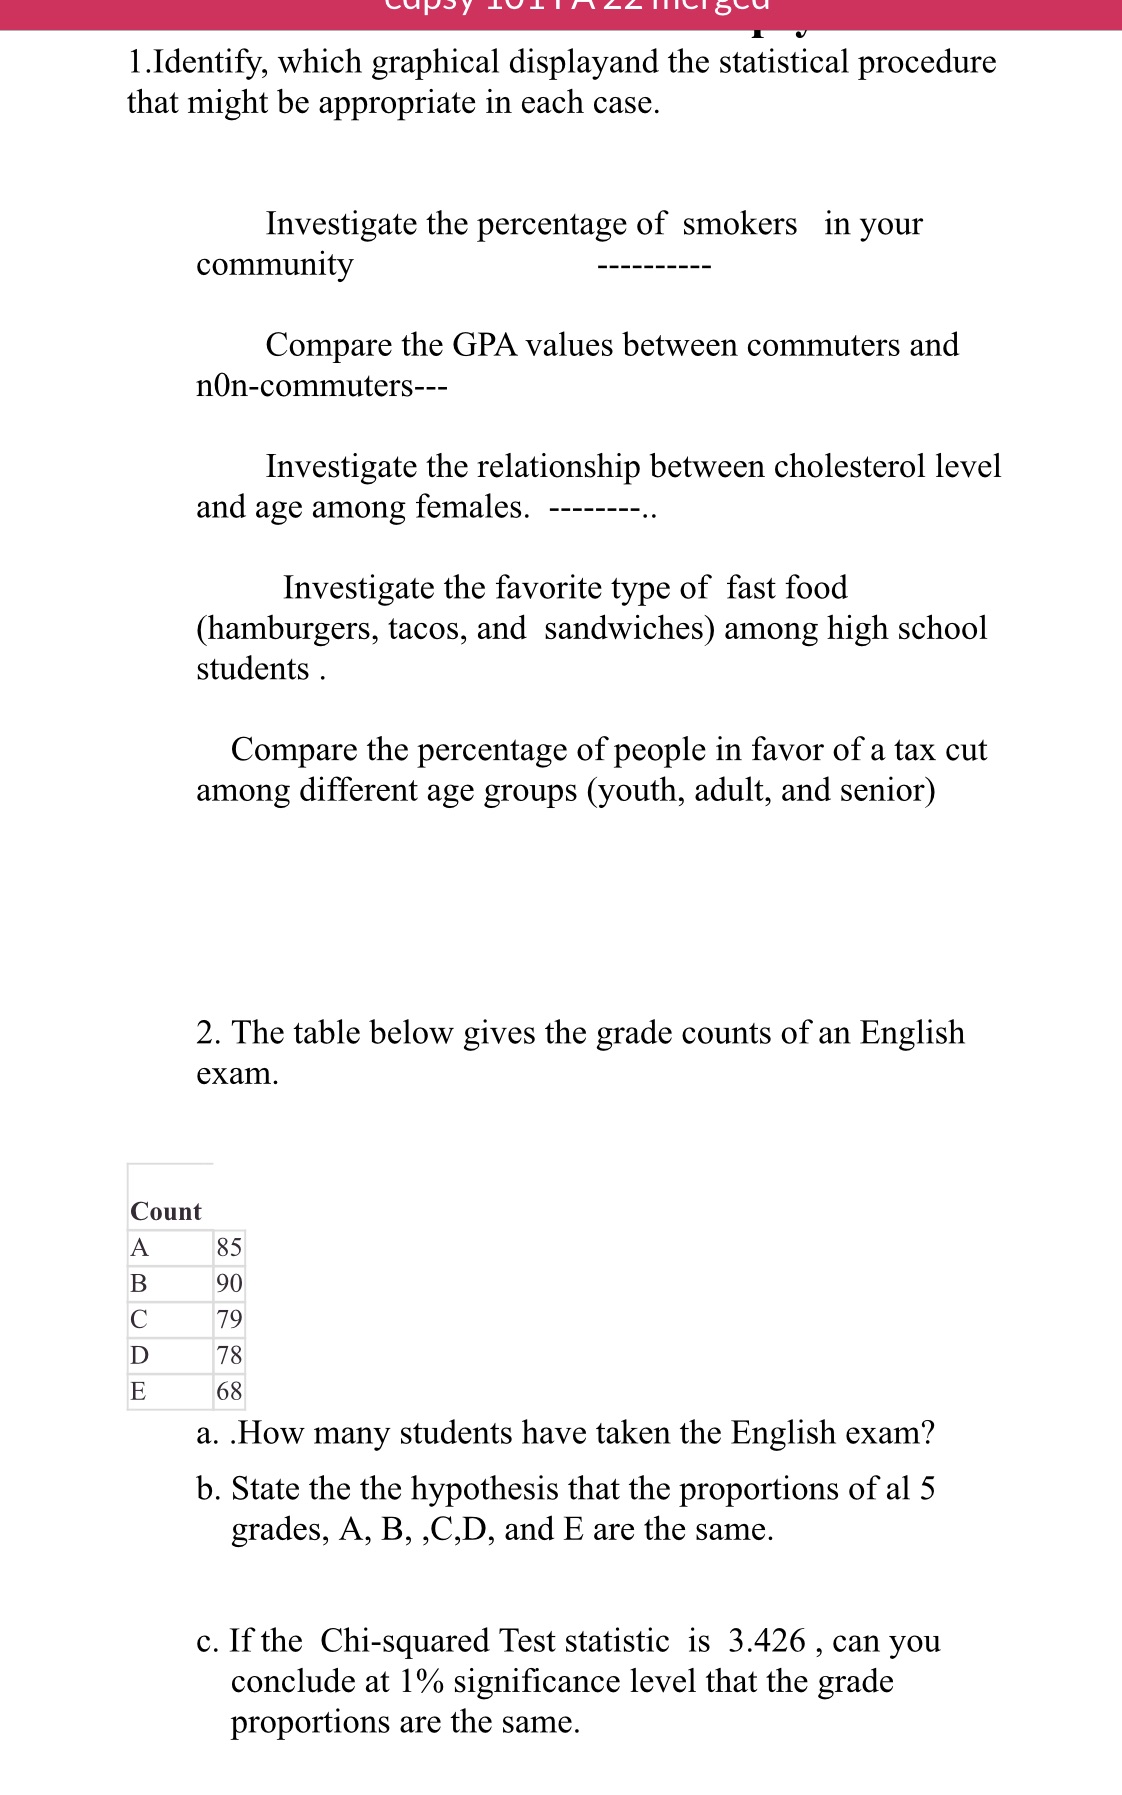
1.1dentify, which graphical displayand the statistical procedure that might be appropriate in each case. Investigate the percentage of smokers in your community __________ Compare the GPA values between commuters and nOn-commuters--- Investigate the relationship between cholesterol level and age among females. -------- .. Investigate the favorite type of fast food (hamburgers, tacos, and sandwiches) among high school students . Compare the percentage of people in favor of a tax out among different age groups (youth, adult, and senior) 2. The table below gives the grade counts of an English exam. Count A 85 B 90 C 79 D 78 E 68 a. .How many students have taken the English exam? b. State the the hypothesis that the proportions of a1 5 grades, A, B, ,C,D, and E are the same. c. If the Chi-squared Test statistic is 3.426 , can you conclude at 1% signicance level that the grade proportions are the same
Step by Step Solution
There are 3 Steps involved in it

Get step-by-step solutions from verified subject matter experts