

Question: 12. 8 classes for n = 75 measurements; minimum value = 0; maximum value = 192 DATA SET DS0115 Relative Frequency Histogram I Construct
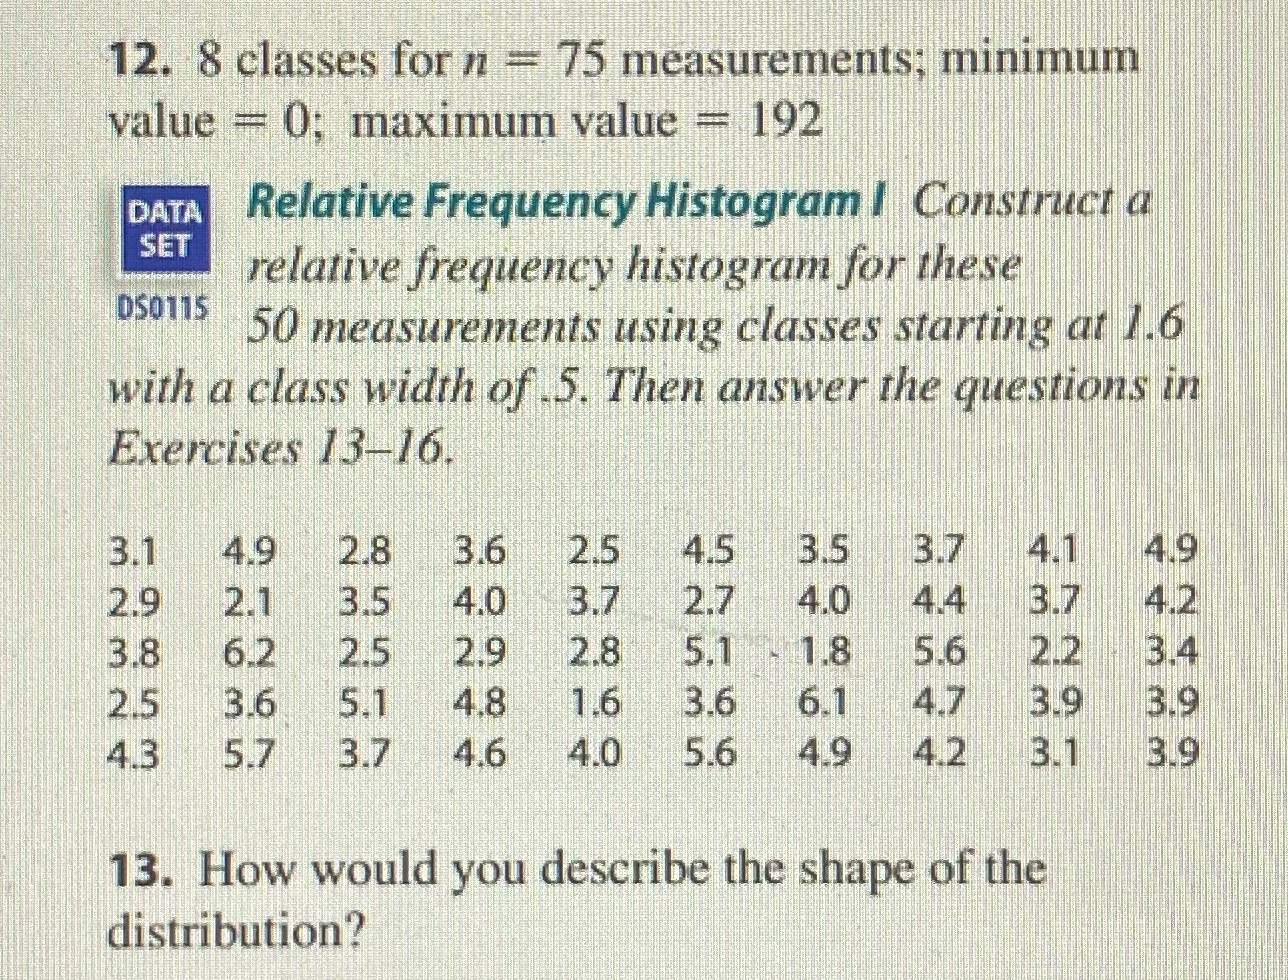
12. 8 classes for n = 75 measurements; minimum value = 0; maximum value = 192 DATA SET DS0115 Relative Frequency Histogram I Construct a relative frequency histogram for these 50 measurements using classes starting at 1.6 with a class width of .5. Then answer the questions in Exercises 13-16. 3.1 4.9 2.8 3.6 2.5 4.5 3.5 3.7 4.1 4.9 2.9 2.1 3.5 4.0 3.7 2.7 4.0 4.4 3.7 4.2 3.8 6.2 2.5 2.9 2.8 5.1 1.8 5.6 2.2 3.4 2.5 3.6 5.1 4.8 1.6 3.6 6.1 4.7 3.9 3.9 4.3 5.7 3.7 4.6 4.0 5.6 4.9 4.2 3.1 3.9 13. How would you describe the shape of the distribution?
Step by Step Solution
There are 3 Steps involved in it
1 Expert Approved Answer
Step: 1 Unlock

Question Has Been Solved by an Expert!
Get step-by-step solutions from verified subject matter experts
Step: 2 Unlock
Step: 3 Unlock