

Question: 12) Calculate the correlation coefficient, r, for the data below. 12) -1 1 8 5 3 2 4 6 7 0 y 0 2 19
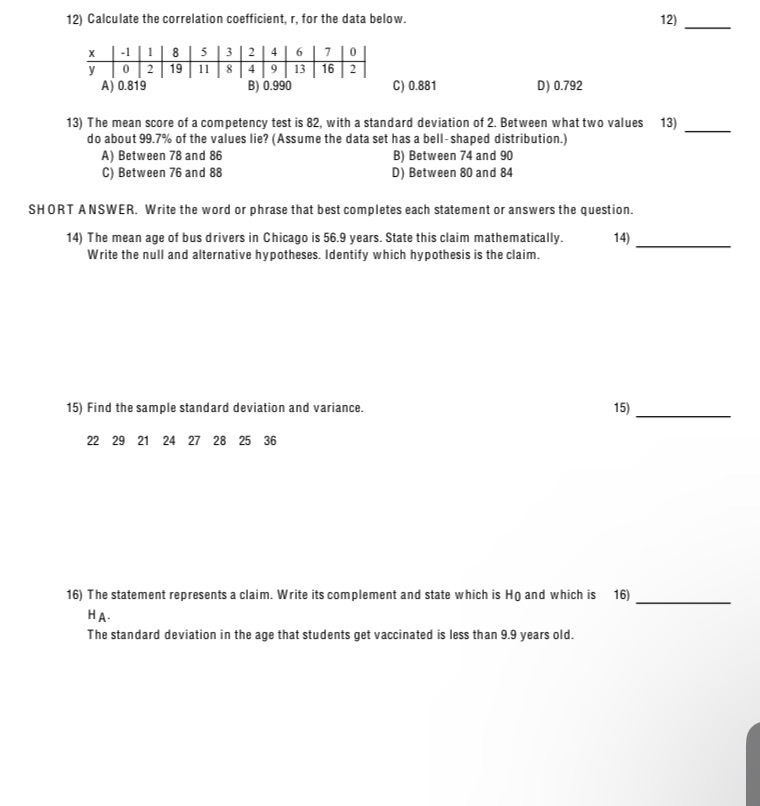
12) Calculate the correlation coefficient, r, for the data below. 12) -1 1 8 5 3 2 4 6 7 0 y 0 2 19 11 8 4 9 13 16 2 A) 0.819 B) 0.990 C) 0.881 D) 0.792 13) The mean score of a competency test is 82, with a standard deviation of 2. Between what two values 13) do about 99.7% of the values lie? (Assume the data set has a bell-shaped distribution.) A) Between 78 and 86 B) Between 74 and 90 C) Between 76 and 88 D) Between 80 and 84 SHORT ANSWER. Write the word or phrase that best completes each statement or answers the question. 14) The mean age of bus drivers in Chicago is 56.9 years. State this claim mathematically. 14) Write the null and alternative hypotheses. Identify which hypothesis is the claim. 15) Find the sample standard deviation and variance. 15) 22 29 21 24 27 28 25 36 16) The statement represents a claim. Write its complement and state which is Ho and which is 16) HA The standard deviation in the age that students get vaccinated is less than 9.9 years old
Step by Step Solution
There are 3 Steps involved in it

Get step-by-step solutions from verified subject matter experts