

Question: 12 explanations. Show all your work. Indicate clearly the methods you use, because you will be scored on the correctness of your methods as well
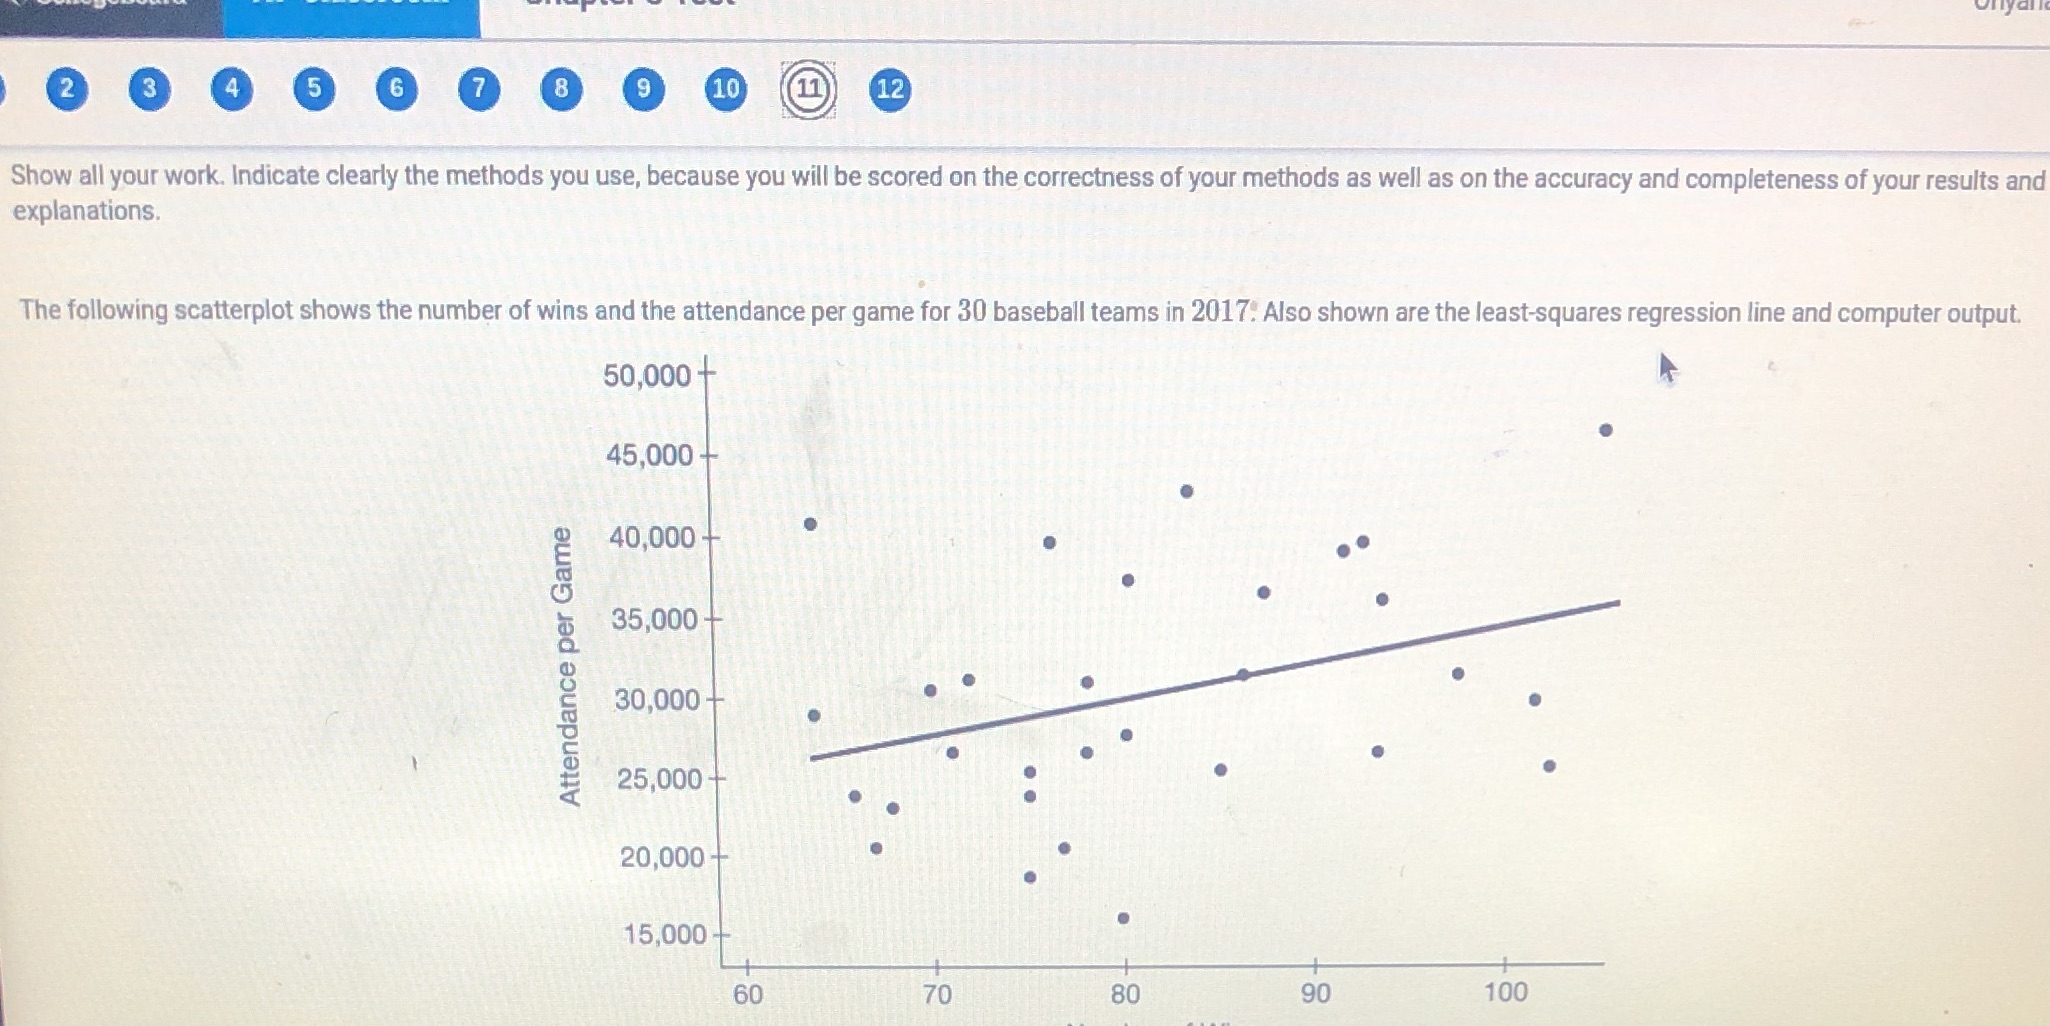
12 explanations. Show all your work. Indicate clearly the methods you use, because you will be scored on the correctness of your methods as well as on the accuracy and completeness of your results and The following scatterplot shows the number of wins and the attendance per game for 30 baseball teams in 2017: Also shown are the least-squares regression line and computer output. 50,000+ 45,000- Attendance per Game 40,000 35,000- 30,000- 25,000+ 20,000 15,000- 60 70 80 90 100
Step by Step Solution
There are 3 Steps involved in it
1 Expert Approved Answer
Step: 1 Unlock

Question Has Been Solved by an Expert!
Get step-by-step solutions from verified subject matter experts
Step: 2 Unlock
Step: 3 Unlock