

Question: 12 PLS 2 Use the boxplot below to identify the following values: 50 65 70 75 80 85 90 95 100 Minimum value is Quartile
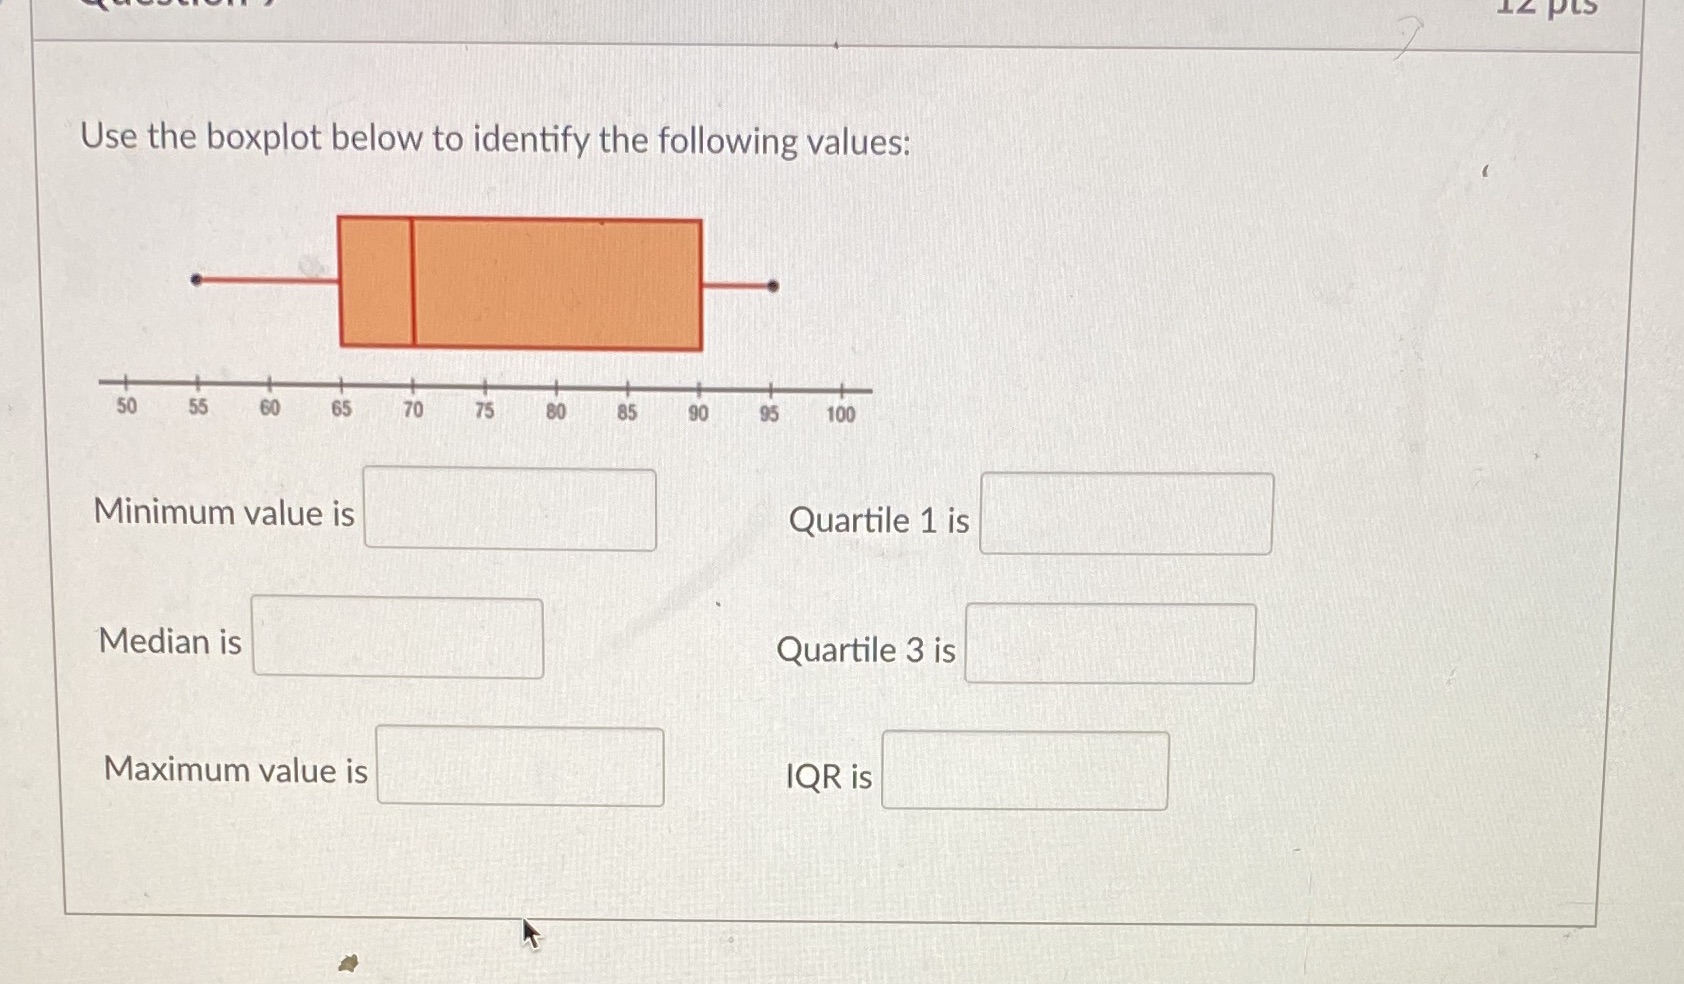
12 PLS 2 Use the boxplot below to identify the following values: 50 65 70 75 80 85 90 95 100 Minimum value is Quartile 1 is Median is Quartile 3 is Maximum value is IQR is
Step by Step Solution
There are 3 Steps involved in it
1 Expert Approved Answer
Step: 1 Unlock

Question Has Been Solved by an Expert!
Get step-by-step solutions from verified subject matter experts
Step: 2 Unlock
Step: 3 Unlock