

Question: 12. Repeat the steps 3 to 10 by increasing the number of recorded times to 40. State the new standard deviation and gavmge. a) What
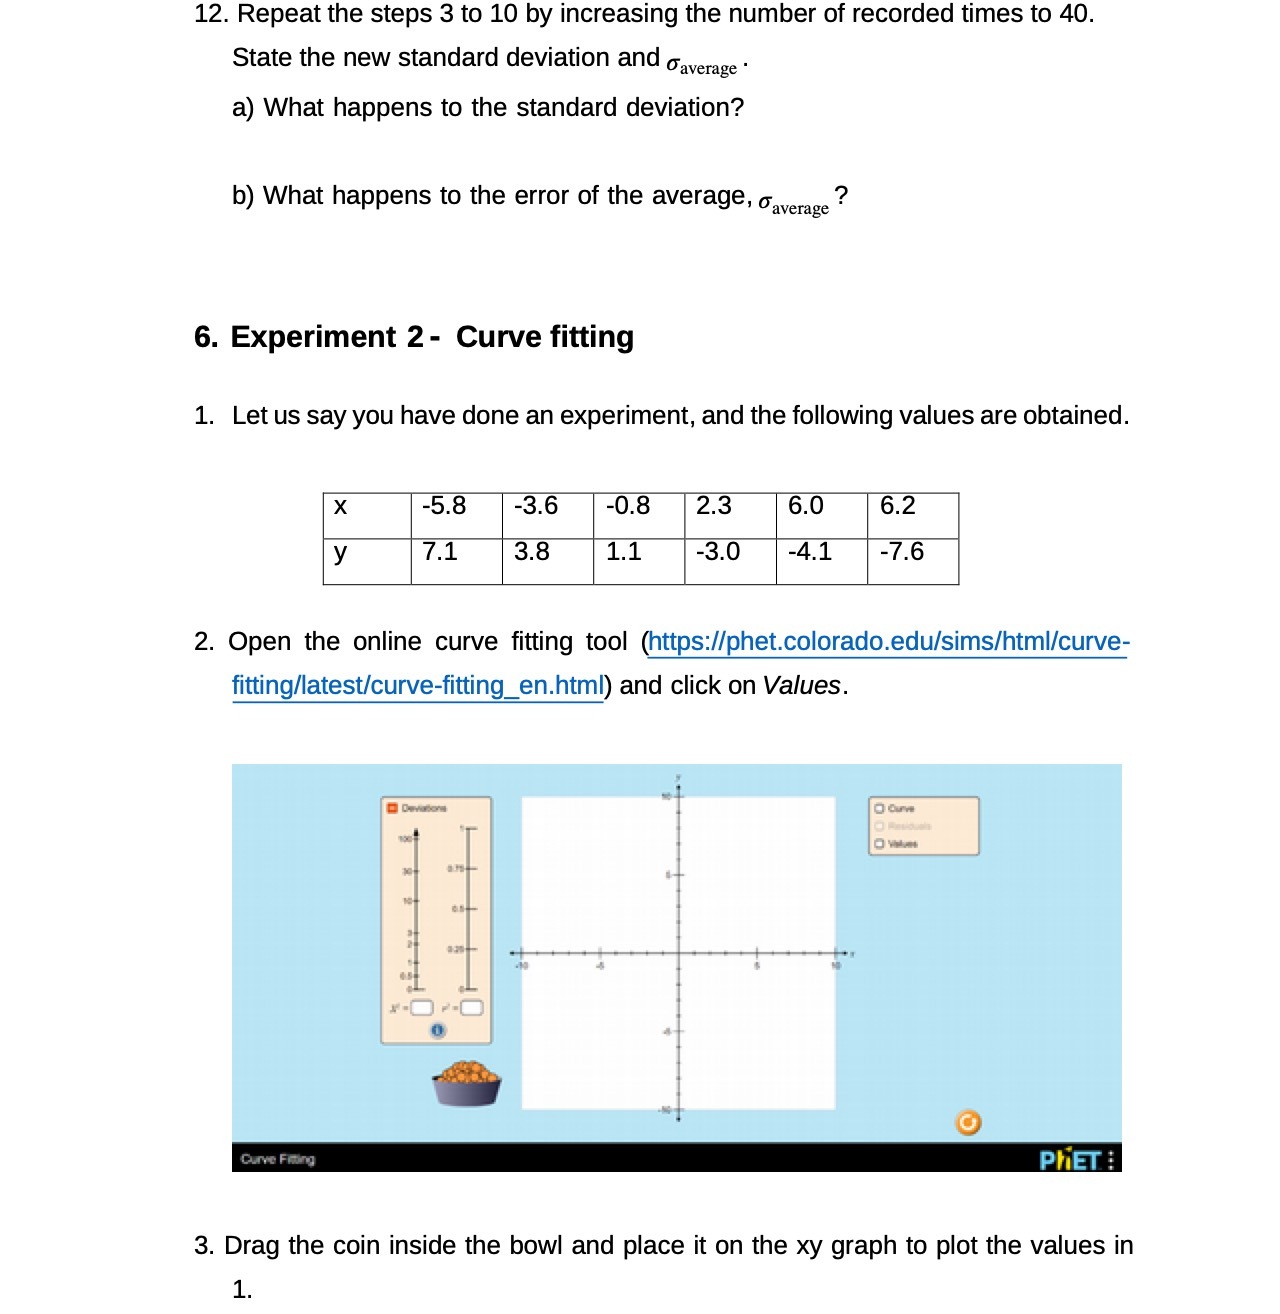

12. Repeat the steps 3 to 10 by increasing the number of recorded times to 40. State the new standard deviation and gavmge. a) What happens to the standard deviation? b) What happens to the error of the average ? ' \"average 6. Experiment 2- Curve fitting 1. Let us say you have done an experiment, and the following values are obtained. 2. Open the online curve fitting tool (https:llphet.colorado.edulsimslhtmll'curve- ttingflatestlcurve-tting_en.html) and click on Values. 3. Drag the coin inside the bowl and place it on the xy graph to plot the values in 1
Step by Step Solution
There are 3 Steps involved in it
1 Expert Approved Answer
Step: 1 Unlock

Question Has Been Solved by an Expert!
Get step-by-step solutions from verified subject matter experts
Step: 2 Unlock
Step: 3 Unlock