

Question: 12. Table 4 shown at the right has the data for a study that tested aging and muscle effects on sensory traits. How did
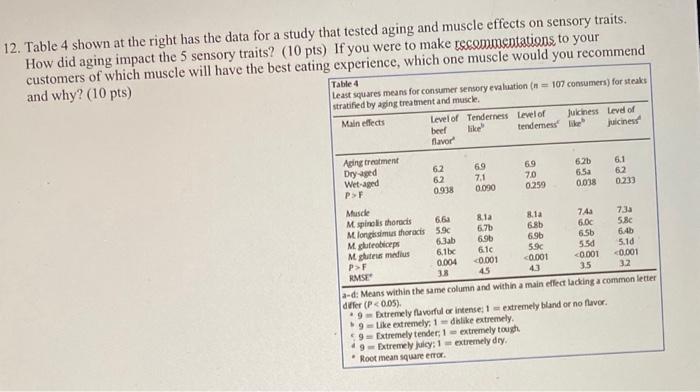
12. Table 4 shown at the right has the data for a study that tested aging and muscle effects on sensory traits. How did aging impact the 5 sensory traits? (10 pts) If you were to make recommentations to your customers of which muscle will have the best eating experience, which one muscle would you recommend and why? (10 pts) Table 4 Least squares means for consumer sensory evaluation (n=107 consumers) for steaks stratified by aging treatment and muscle. Main effects Level of Tenderness Level of Juiciness Level of beef like tenderness like juiciness flavor Aging treatment Dry-aged 62 69 69 62b 6.1 Wet-aged 62 7.1 7.0 65a 62 P>F 0938 0.090 0.259 0.038 0.233 Muscle M spinolls thoracis 6.6a 8.1a 8.1a 7.Aa 73a M. longissimus thoracis 5.9c 6.7b 6.8b 6.0c 58c M. gluteobiceps 6.3ab 6.9b 6.96 65b 64b M gluteus medius 6.1bc 61c 59c 5.5d 5.1d P>F 0.004
Step by Step Solution
There are 3 Steps involved in it

Get step-by-step solutions from verified subject matter experts