

Question: 12 The coordinates of a function h x are shown in the table X 1 0 HEL daude THE Inl la 2 10 4 h
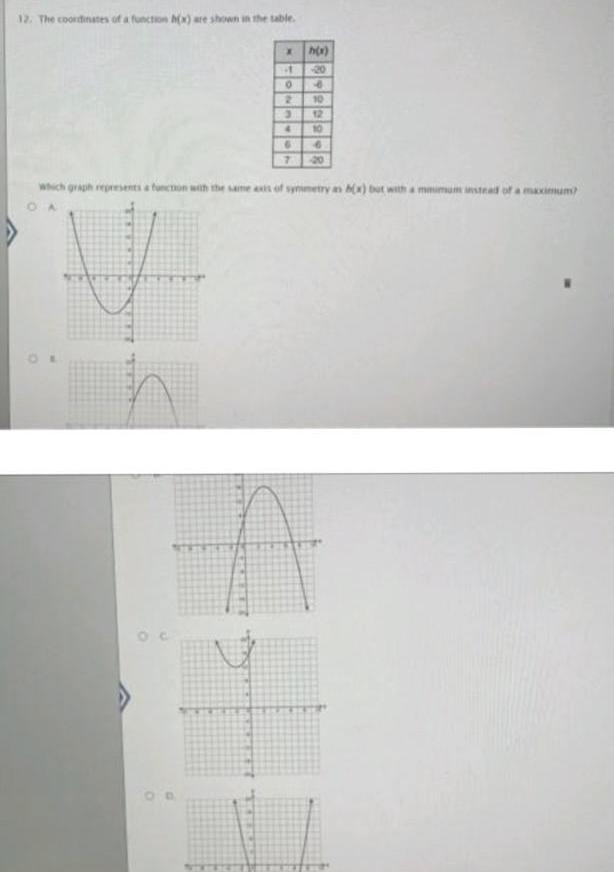

12 The coordinates of a function h x are shown in the table X 1 0 HEL daude THE Inl la 2 10 4 h x 20 4 3 12 6 1999 7 10 6 20 which graph represents a function with the same axis of synimetry as b x but with a mimum instead of a maximum y
Step by Step Solution
There are 3 Steps involved in it
1 Expert Approved Answer
Step: 1 Unlock

Question Has Been Solved by an Expert!
Get step-by-step solutions from verified subject matter experts
Step: 2 Unlock
Step: 3 Unlock