

Question: 12. The data in Table 7 were collected in 1996 by a large ongoing study, the Australian Longitu- dinal Study on Women's Health (courtesy
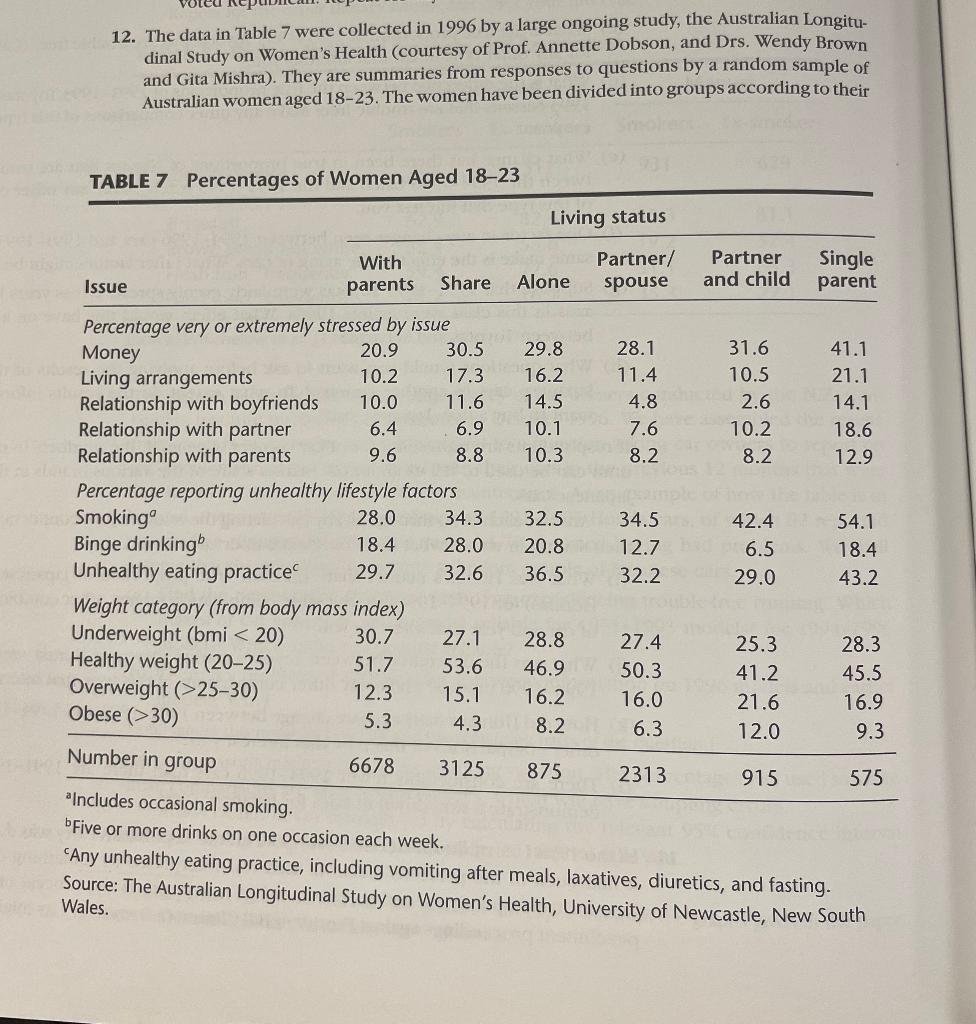

12. The data in Table 7 were collected in 1996 by a large ongoing study, the Australian Longitu- dinal Study on Women's Health (courtesy of Prof. Annette Dobson, and Drs. Wendy Brown and Gita Mishra). They are summaries from responses to questions by a random sample of Australian women aged 18-23. The women have been divided into groups according to their TABLE 7 Percentages of Women Aged 18-23 Issue With parents Share Alone Percentage very or extremely stressed by issue Money Living arrangements Relationship with boyfriends Relationship with partner Relationship with parents 20.9 10.2 10.0 6.4 9.6 30.5 17.3 11.6 6.9 8.8 Percentage reporting unhealthy lifestyle factors Smoking 28.0 Binge drinkingb 18.4 Unhealthy eating practice 29.7 Weight category (from body mass index) Underweight (bmi < 20) 30.7 Healthy weight (20-25) 51.7 Overweight (>25-30) Obese (>30) Living status Partner/ spouse 27.1 53.6 15.1 albel 29.8 16.2 14.5 10.1 10.3 34.3 28.0 20.8 32.6 36.5 28.8 46.9 12.3 16.2 5.3 4.3 8.2 6678 3125 875 28.1 11.4 4.8 7.6 8.2 Partner and child 27.4 50.3 16.0 6.3 2313 31.6 10.5 2.6 10.2 8.2 32.5 34.5 42.4 54.1 12.7 had 6.5 18.4 32.2 29.0 43.2 25.3 41.2 21.6 12.0 Single parent 41.1 21.1 14.1 18.6 12.9 915 28.3 45.5 16.9 9.3 575 Number in group "Includes occasional smoking. Five or more drinks on one occasion each week. to say Any unhealthy eating practice, including vomiting after meals, laxatives, diuretics, and fasting. Source: The Australian Longitudinal Study on Women's Health, University of Newcastle, New South organ Wales. living arrangements. We have reported data from some of the questions asked about causes of pronounced stress (e.g., 20.9% of young women living with parents reported being very stressed by money matters), on unhealthy lifestyle factors (e.g., 28% of those living with their parents smoked), and on weight categories (e.g., 30.7% of those living with parents were underweight). (a) What interesting and/or surprising features can you see in the data in Table 7? (b) Are there some living-status groups that you might expect to contain women who are older (or younger) on average than other groups? What problems, if any, might this create when we interpret differences between groups? (c) What are some other sources of stress affecting many people that should be consid- ered? (The issues reported here are only a subset of those investigated in the study.) (d) Calculate a 95% confidence interval for the true proportion of young women living in shared accommodations who are stressed by their living arrangements. (e) Calculate a 95% confidence interval for the true difference between the proportion of those living alone who are stressed by relationships with boyfriends and the propor- tion of those living in shared accommodations who are stressed by relationships with boyfriends. (f) For those living alone, calculate a 95% confidence interval for the true difference be- tween the proportion stressed by money problems and the proportion stressed by their living arrangements. (g) For those living with a partner and child, calculate a 95% confidence interval for the true difference between the proportion in the underweight category and the propor- tion in the overweight category.
Step by Step Solution
3.43 Rating (156 Votes )
There are 3 Steps involved in it
a Some interesting andor surprising features that can be seen in the data in Table 7 include The high percentage of women who are stressed by money ma... View full answer

Get step-by-step solutions from verified subject matter experts