

Question: 1-2: The test data of a pressure sensor is shown in the following table, calculate the nonlinear error, hysteresis and repeatability error. Output value/mV
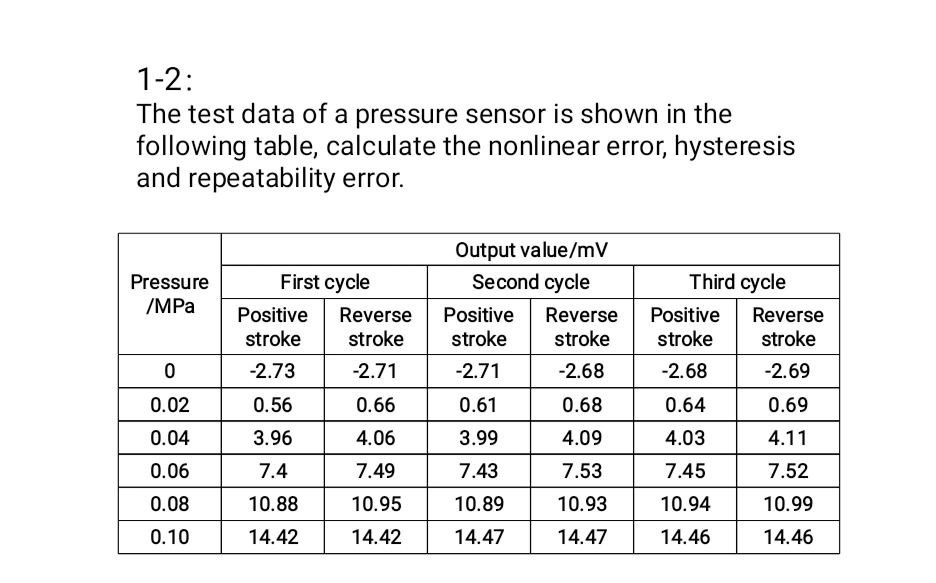
1-2: The test data of a pressure sensor is shown in the following table, calculate the nonlinear error, hysteresis and repeatability error. Output value/mV Pressure First cycle Second cycle Third cycle /MPa Positive Reverse Positive Reverse Positive Reverse stroke stroke stroke stroke stroke stroke 0 -2.73 -2.71 -2.71 -2.68 -2.68 -2.69 0.02 0.56 0.66 0.61 0.68 0.64 0.69 0.04 3.96 4.06 3.99 4.09 4.03 4.11 0.06 7.4 7.49 7.43 7.53 7.45 7.52 0.08 10.88 10.95 10.89 10.93 10.94 10.99 0.10 14.42 14.42 14.47 14.47 14.46 14.46
Step by Step Solution
There are 3 Steps involved in it
Solutions From the data given first we have to make a most fitting linear relation between pressure ... View full answer

Get step-by-step solutions from verified subject matter experts