

Question: 12:13 1. Micro Winter 2021 - Saved O E . . . Question 3 (Marks 12) a. The following graph shows the demand curve for

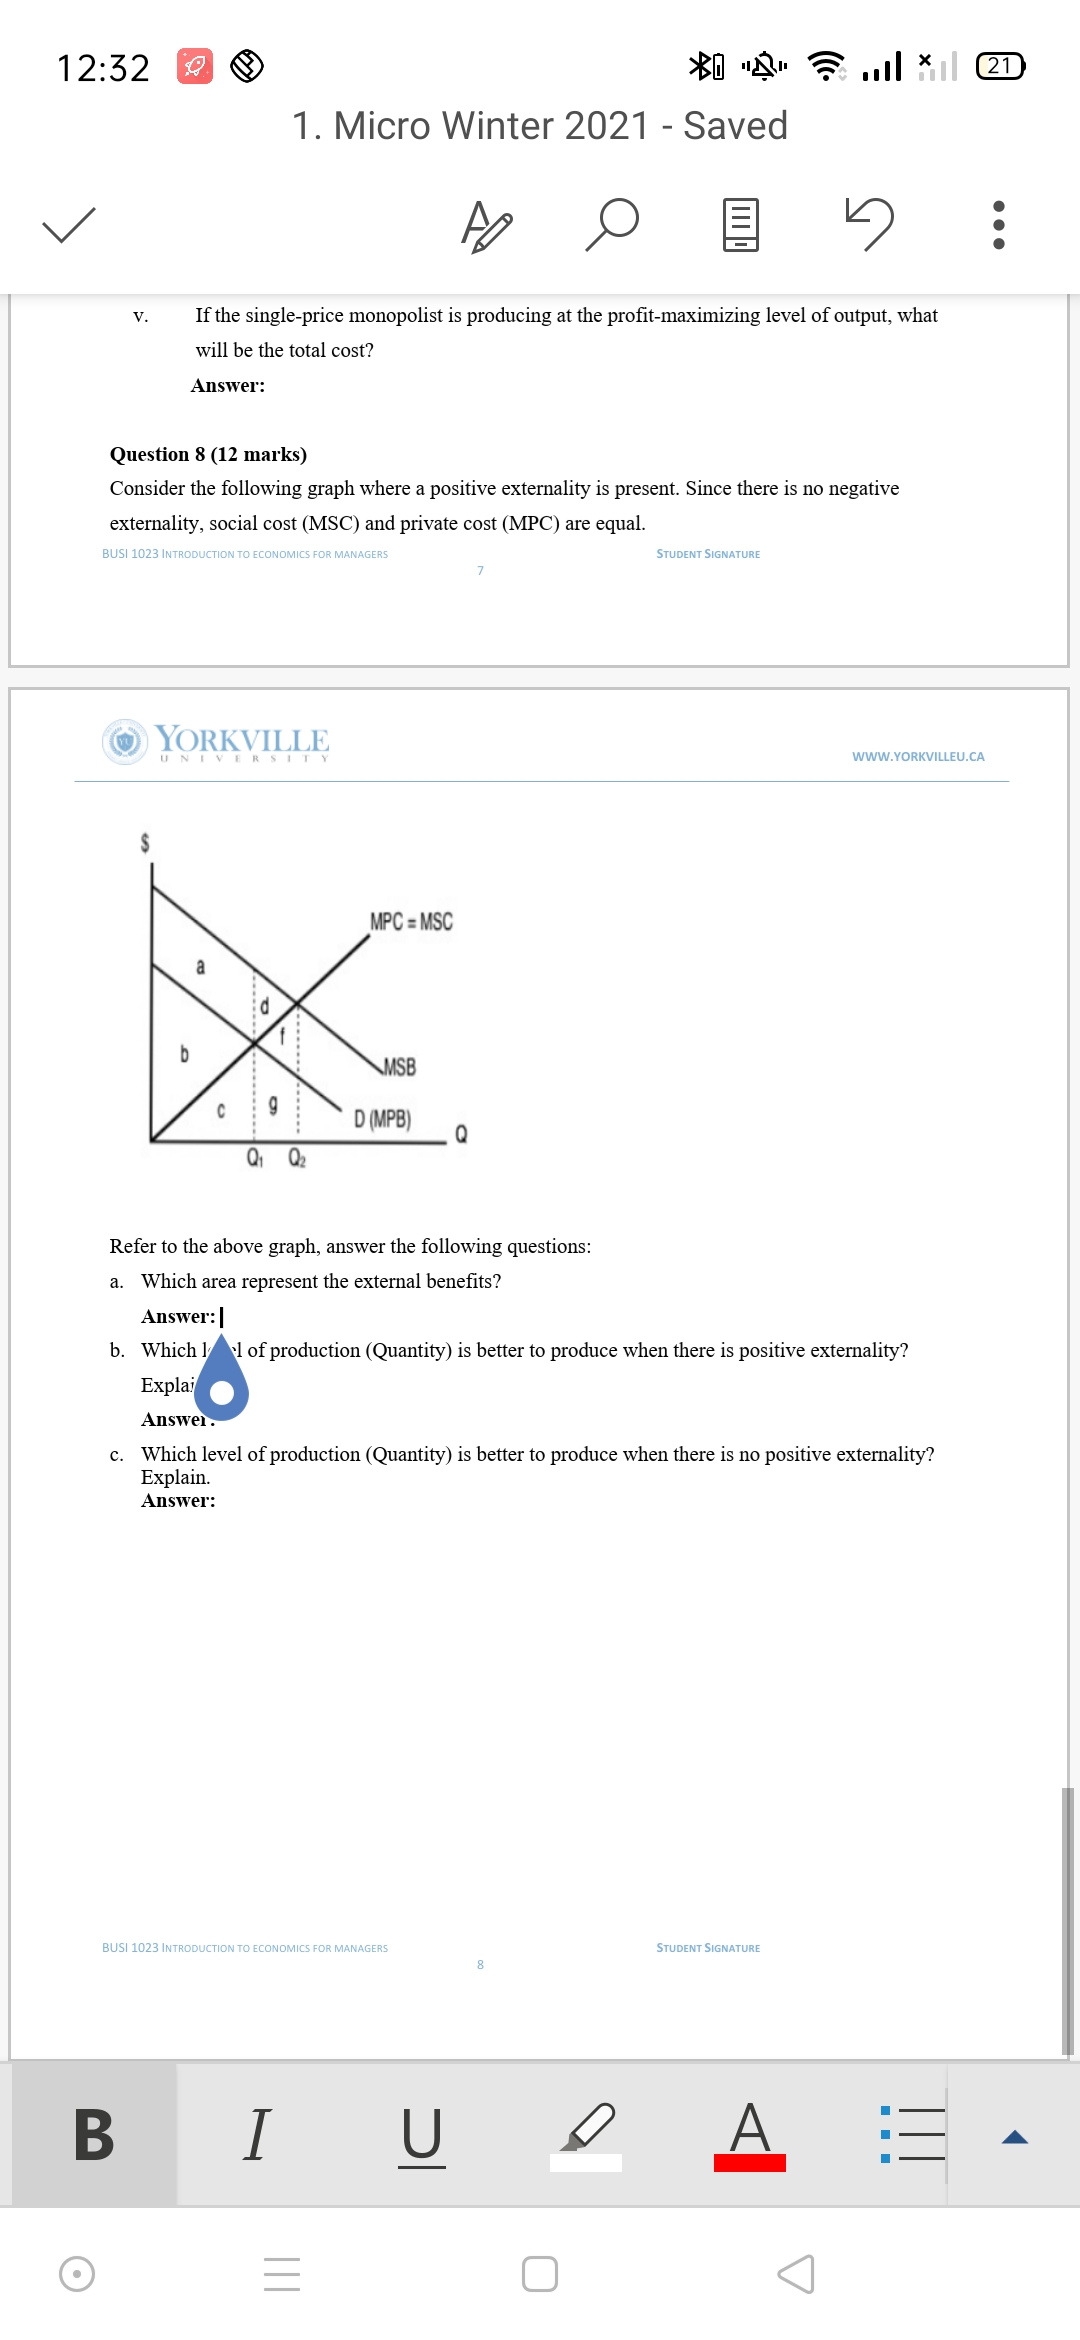
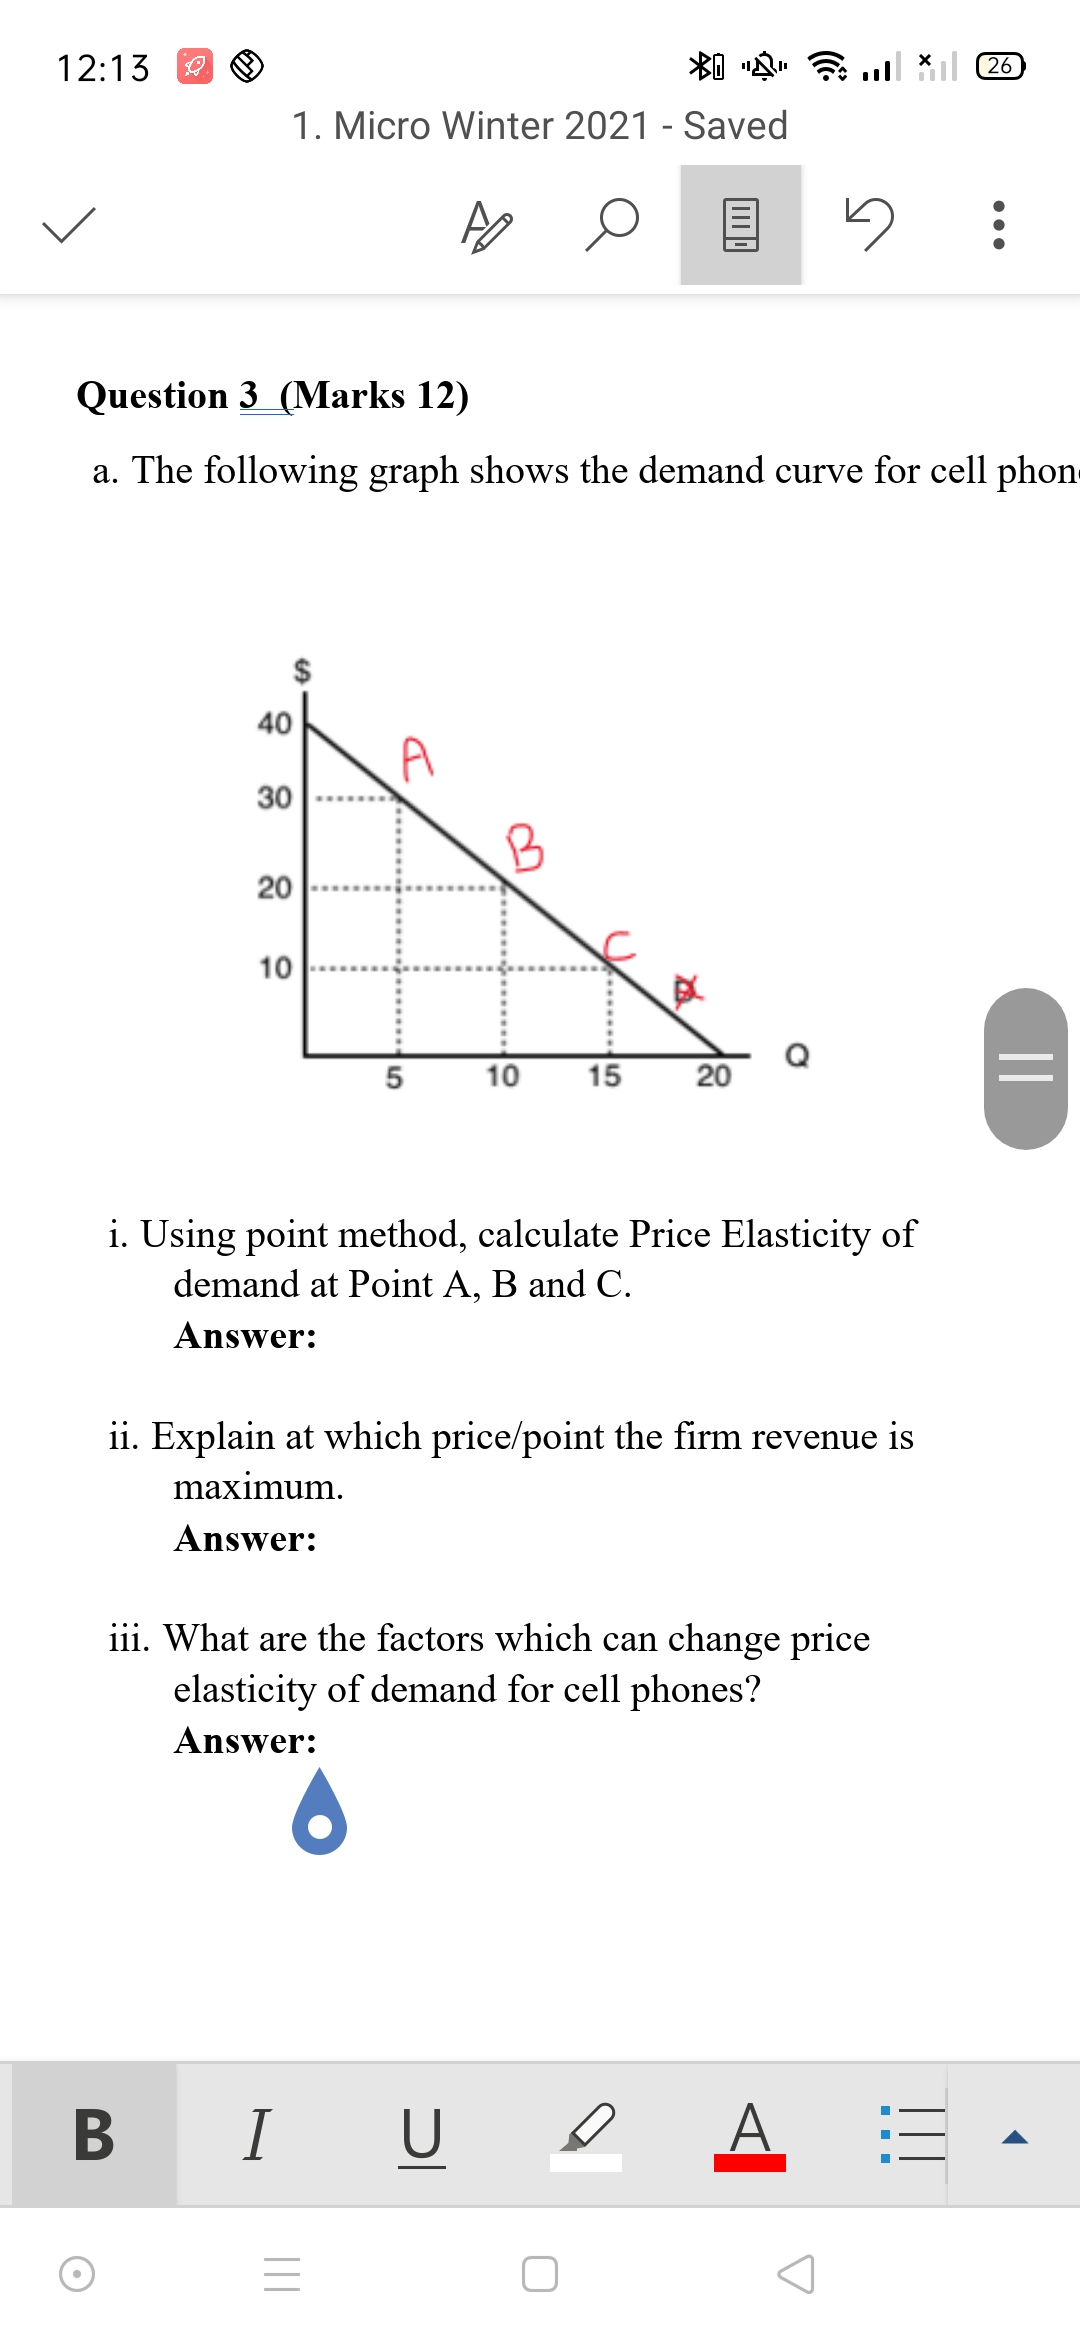

12:13 1. Micro Winter 2021 - Saved O E . . . Question 3 (Marks 12) a. The following graph shows the demand curve for cell phon 40 A 30 .... B 20 ........j..... 10 -. ... ...... ..... Q 10 15 20 = i. Using point method, calculate Price Elasticity of demand at Point A, B and C. Answer: ii. Explain at which price/point the firm revenue is maximum. Answer: iii. What are the factors which can change price elasticity of demand for cell phones? Answer: B U O E O12:32 1. Micro Winter 2021 - Saved O . . . V . If the single-price monopolist is producing at the profit-maximizing level of output, what will be the total cost? Answer: Question 8 (12 marks) Consider the following graph where a positive externality is present. Since there is no negative externality, social cost (MSC) and private cost (MPC) are equal. BUSI 1023 INTRODUCTION TO ECON STUDENT SIGNATURE YORKVILLE WWW.YORKVILLEU.CA MPC = MSC MSB D (MPB) Q Q1 Q2 Refer to the above graph, answer the following questions: a. Which area represent the external benefits? Answer: | b. Which 1 1 of production (Quantity) is better to produce when there is positive externality? Explain Answer . Which level of production (Quantity) is better to produce when there is no positive externality? Explain. Answer: BUSI 1023 INTRODUCTION TO ECONOMICS FOR MANAGERS STUDENT SIGNATURE 8 B U A O E O
Step by Step Solution
There are 3 Steps involved in it

Get step-by-step solutions from verified subject matter experts