

Question: 12.13 The data points for the graph from a final exam example are as follows: (1, 4), (2, 7), (2, 5), (3, 9), (4, 11),
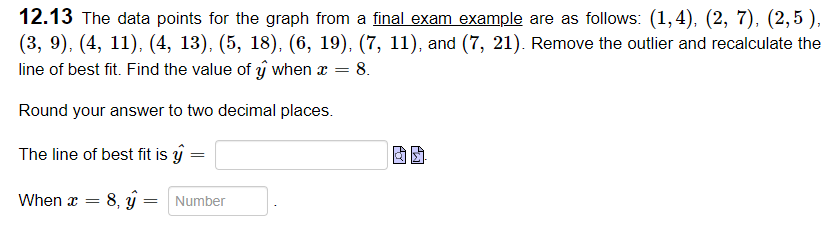
12.13 The data points for the graph from a final exam example are as follows: (1, 4), (2, 7), (2, 5), (3, 9), (4, 11), (4, 13), (5, 18), (6, 19), (7, 11), and (7, 21). Remove the outlier and recalculate the line of best fit. Find the value of y when x = 8. Round your answer to two decimal places. The line of best fit is y = When x = 8, y = Number
Step by Step Solution
There are 3 Steps involved in it
1 Expert Approved Answer
Step: 1 Unlock

Question Has Been Solved by an Expert!
Get step-by-step solutions from verified subject matter experts
Step: 2 Unlock
Step: 3 Unlock