

Question: 12.2 Regression (Textbook Cost) Student Learning Outcomes - The student will calculate and construct the line of best fit between two variables. - The student
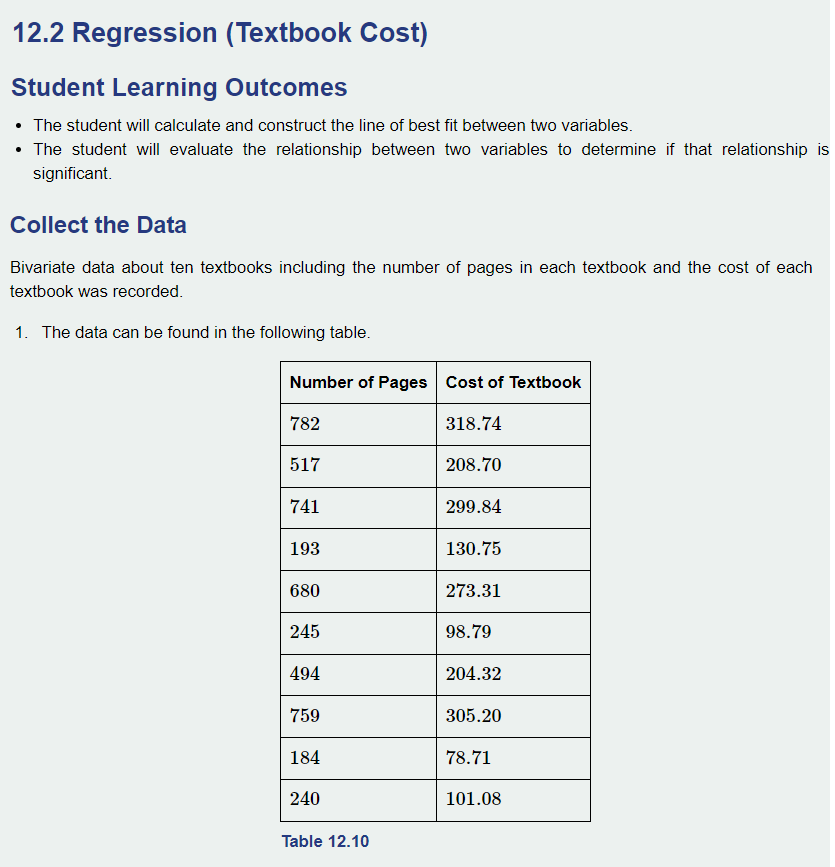
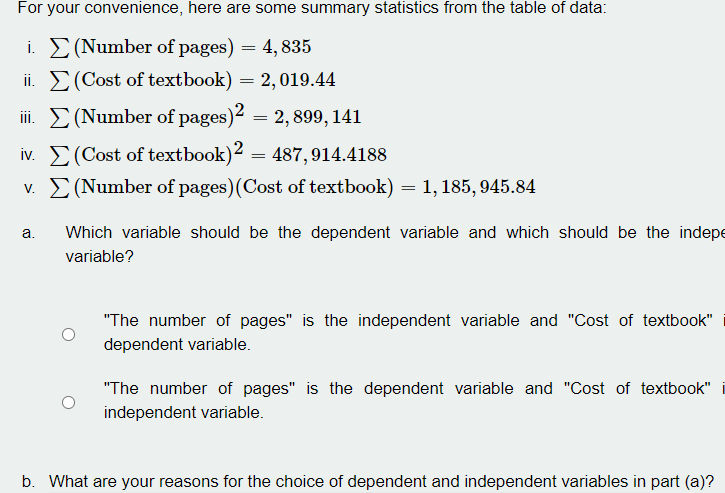


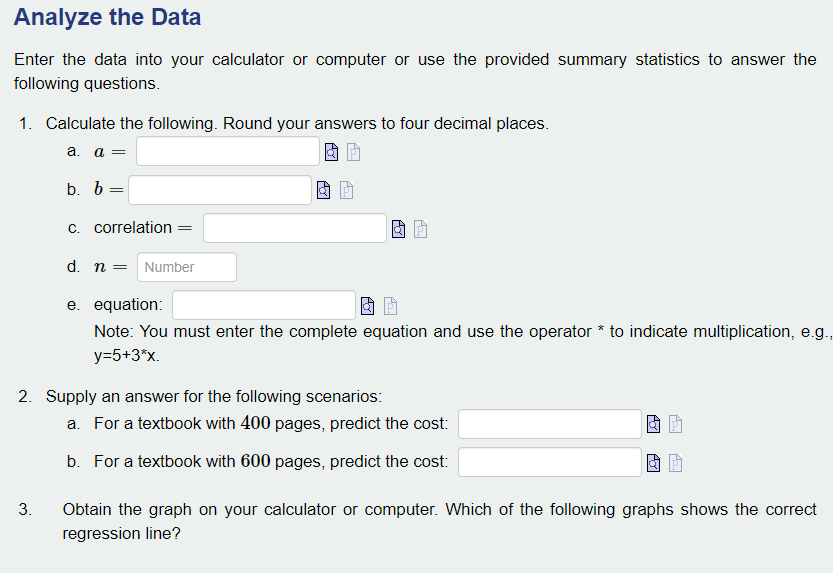
12.2 Regression (Textbook Cost) Student Learning Outcomes - The student will calculate and construct the line of best fit between two variables. - The student will evaluate the relationship between two variables to determine if that relationship is significant. Collect the Data Bivariate data about ten textbooks including the number of pages in each textbook and the cost of each textbook was recorded. 1. The data can be found in the following table. Number of Pages Cost of Textbook 782 Table 12.10 For your convenience, here are some summary statistics from the table of data: i. _ (Number of pages) = 4, 835 ii. _ (Cost of textbook) = 2, 019.44 iii. _ (Number of pages)? = 2, 899, 141 iv. _ (Cost of textbook)2 = 487, 914.4188 v. E (Number of pages) (Cost of textbook) = 1, 185, 945.84 a. Which variable should be the dependent variable and which should be the indep variable? "The number of pages" is the independent variable and "Cost of textbook" O dependent variable. "The number of pages" is the dependent variable and "Cost of textbook" O independent variable. b. What are your reasons for the choice of dependent and independent variables in part (a)?Analyze the Data Enter the data into your calculator or computer or use the provided summary statistics to answer the following questions. 1. Calculate the following. Round your answers to four decimal places. a. a = @ b. b = @ c. correlation = @ cl. n = e. equation: @ Note: You must enter the complete equation and use the operator * to indicate multiplication, e.g.. y=5+3*x. 2. Supply an answer for the following scenarios: a. For a textbook with 4130 pages. predict the cost: @ b. For a textbook with 6130 pages. predict the cost: @ 3. Obtain the graph on your calculator or computer. Which of the following graphs shows the correct regression line?I
Step by Step Solution
There are 3 Steps involved in it

Get step-by-step solutions from verified subject matter experts