

Question: ...... 12:20 12:20 Ch 2 Frequency Distribu... I. 2. 3. 4. 5. Dashboard Chapter 2 Problems from Gravetter and Wallnau (2014) Find each value requested

......
12:20
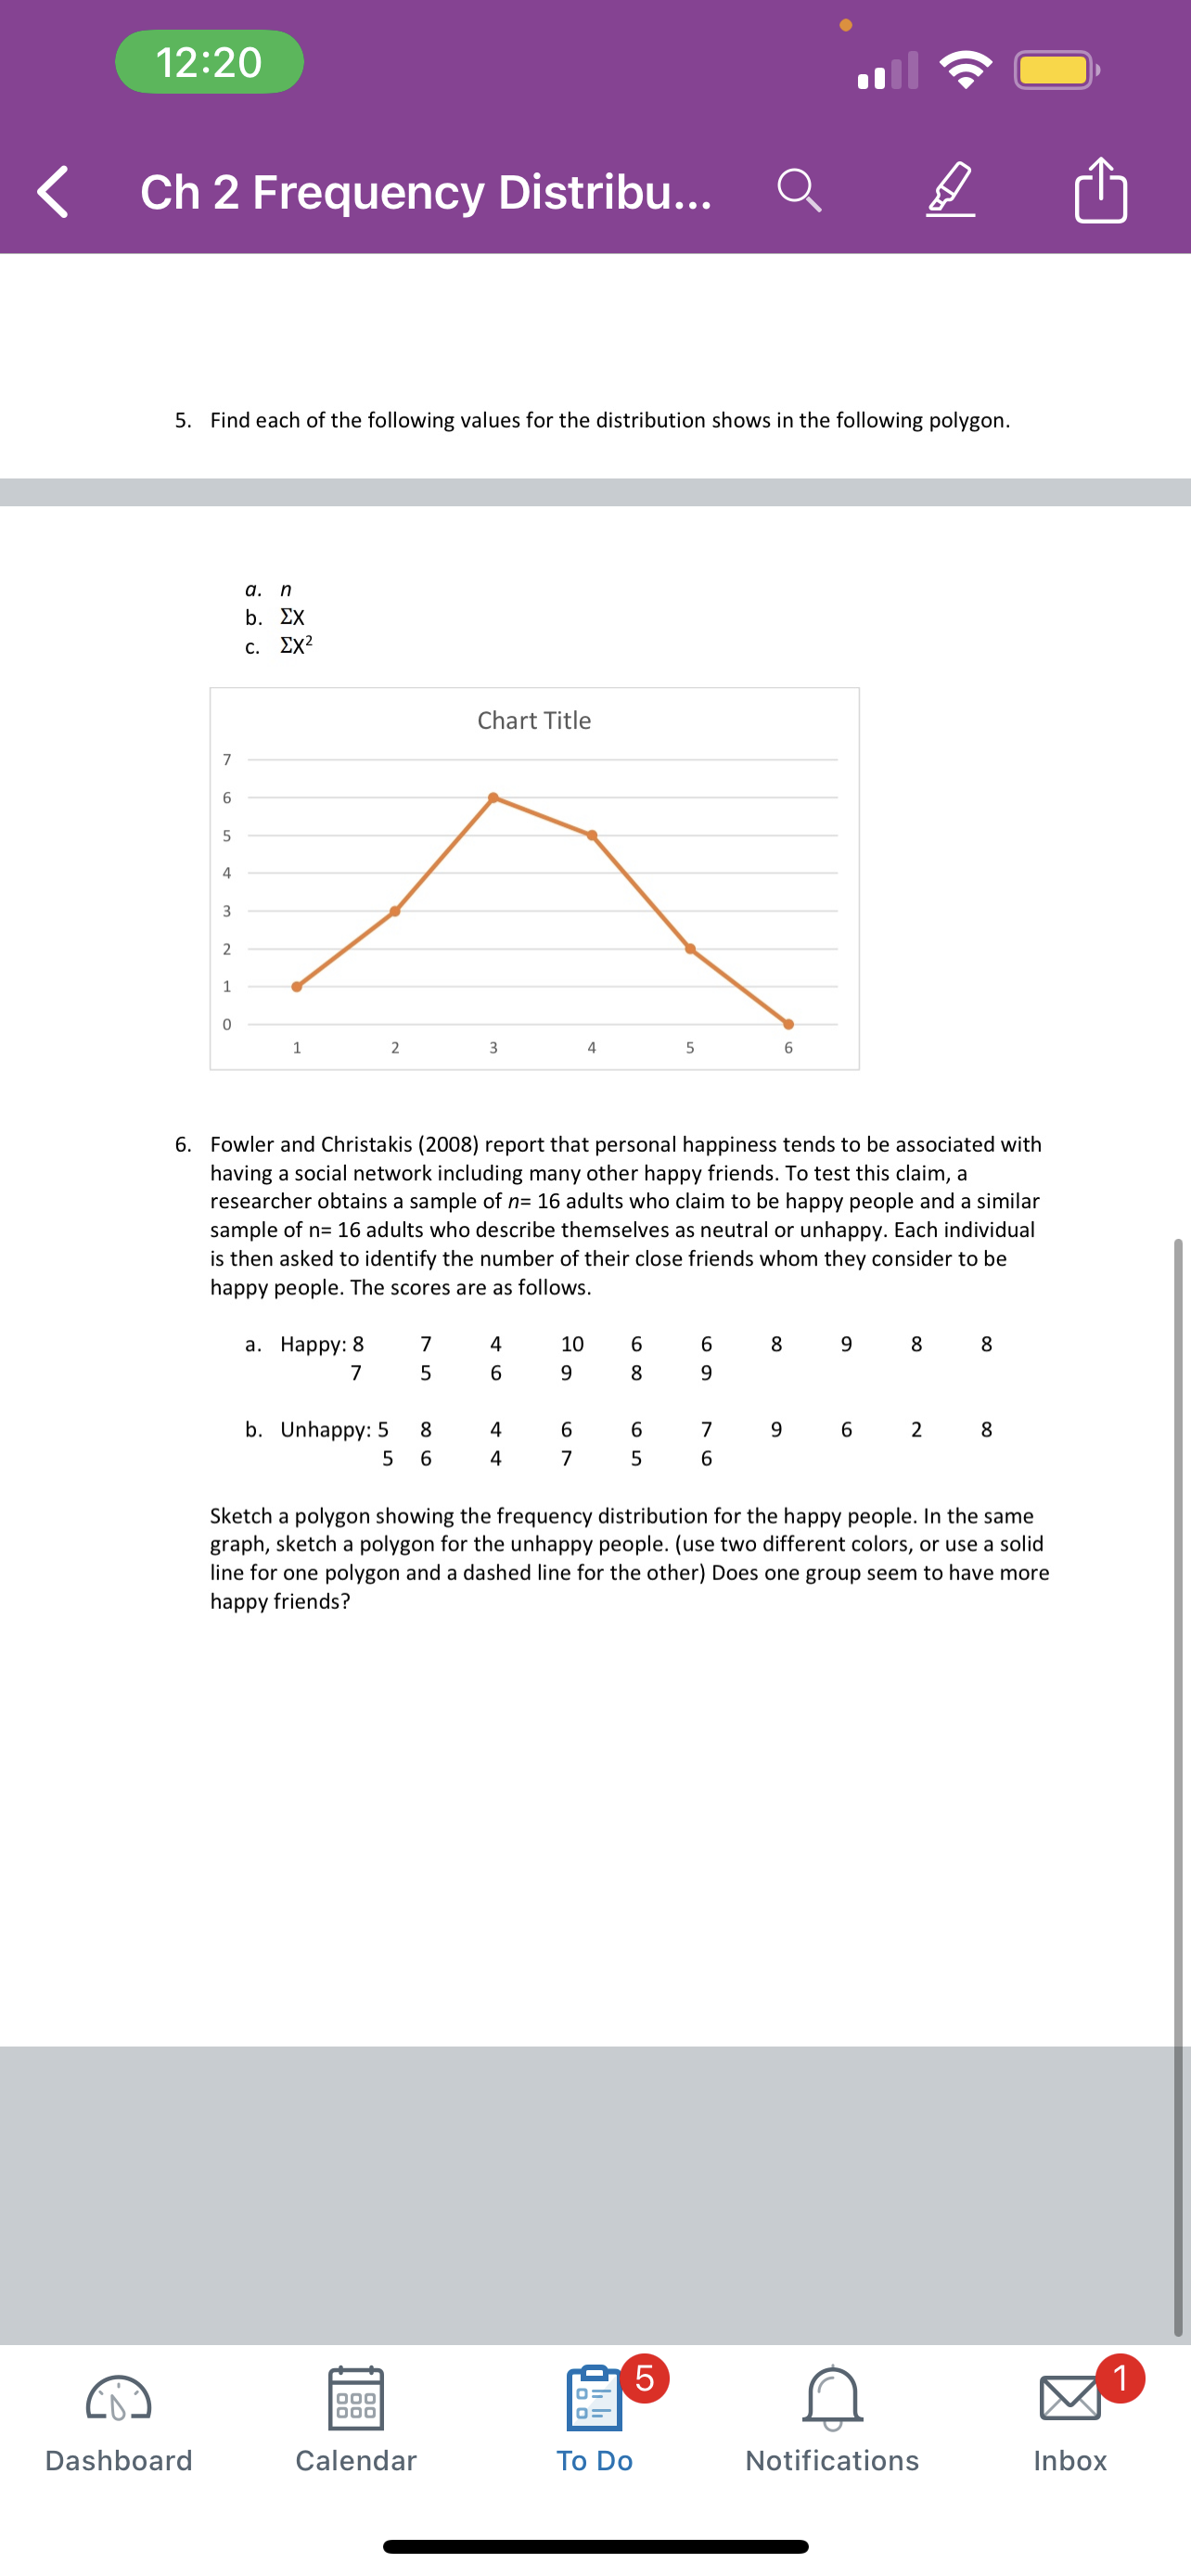
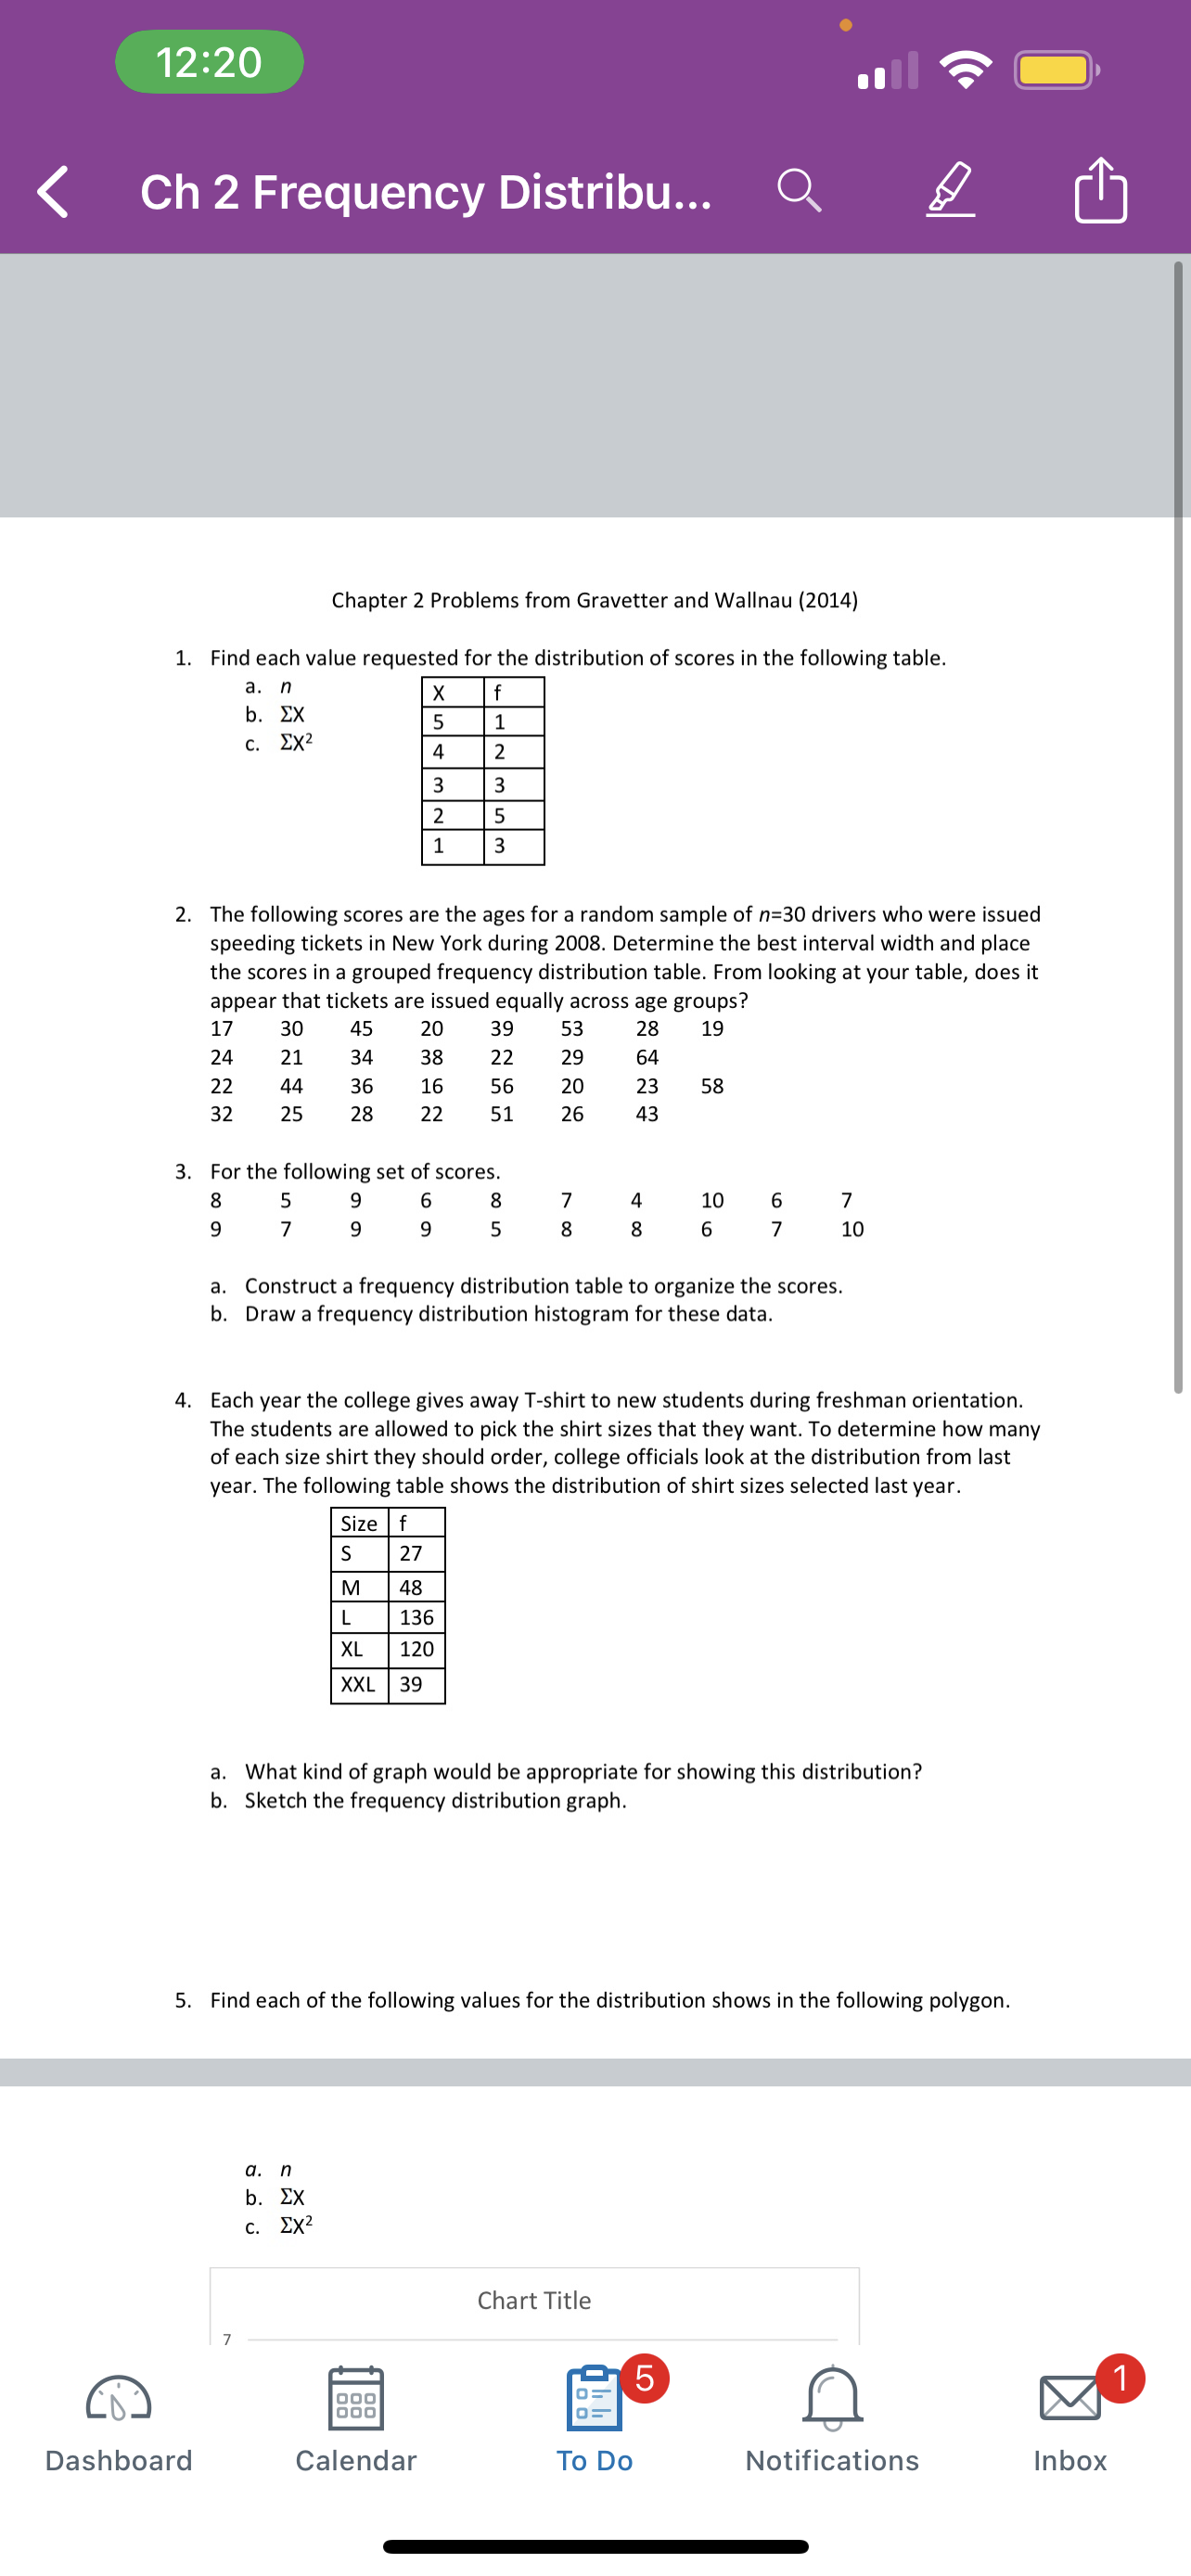
12:20 Ch 2 Frequency Distribu... I. 2. 3. 4. 5. Dashboard Chapter 2 Problems from Gravetter and Wallnau (2014) Find each value requested for the distribution of scores in the following table. The following scores are the ages for a random sample of n=30 drivers who were issued speeding tickets in New York during 2008. Determine the best interval width and place the scores in a grouped frequency distribution table. From looking at your table, does it appear that tickets are issued equally across age groups? 17 24 22 32 30 21 44 25 45 34 36 28 20 38 16 22 39 22 56 51 53 29 20 26 28 64 23 43 For the following set of scores. 19 58 10 10 a. b. Construct a frequency distribution table to organize the scores. Draw a frequency distribution histogram for these data. Each year the college gives away T-shirt to new students during freshman orientation. The students are allowed to pick the shirt sizes that they want. To determine how many of each size shirt they should order, college officials look at the distribution from last year. The following table shows the distribution of shirt sizes selected last year. Size M XL XXL 27 48 136 120 39 a. b. What kind of graph would be appropriate for showing this distribution? Sketch the frequency distribution graph. Find each of the following values for the distribution shows in the following polygon. a. c. n Calendar Chart Title To Do Notifications Inbox
Step by Step Solution
There are 3 Steps involved in it

Get step-by-step solutions from verified subject matter experts