

Question: 1234567 The table below presents the variance - covariance matrix and the mean returns for six different stocks of financial institutions, based on their
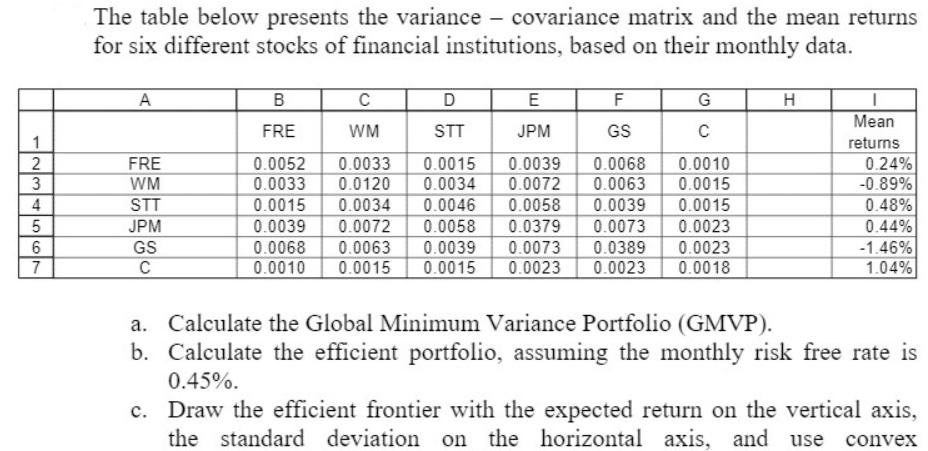
1234567 The table below presents the variance - covariance matrix and the mean returns for six different stocks of financial institutions, based on their monthly data. A FRE WM STT JPM GS C B FRE C WM D STT E JPM F GS G C 0.0033 0.0015 0.0068 0.0010 0.0039 0.0034 0.0072 0.0063 0.0015 0.0052 0.0033 0.0120 0.0015 0.0034 0.0046 0.0039 0.0072 0.0058 0.0379 0.0073 0.0068 0.0063 0.0039 0.0073 0.0058 0.0039 0.0015 0.0023 0.0389 0.0023 0.0010 0.0015 0.0015 0.0023 0.0023 0.0018 H I Mean returns 0.24% -0.89% 0.48% 0.44% -1.46% 1.04% a. Calculate the Global Minimum Variance Portfolio (GMVP). b. Calculate the efficient portfolio, assuming the monthly risk free rate is 0.45%. c. Draw the efficient frontier with the expected return on the vertical axis, the standard deviation on the horizontal axis, and use
Step by Step Solution
3.47 Rating (147 Votes )
There are 3 Steps involved in it
Okay here are the steps to solve this problem a To calculate the Global Minimum Variance Portfolio G... View full answer

Get step-by-step solutions from verified subject matter experts