

Question: 12.4 Using the Short-Run Model We are now ready to put the pieces of our short-run model together and see how they combine to determine

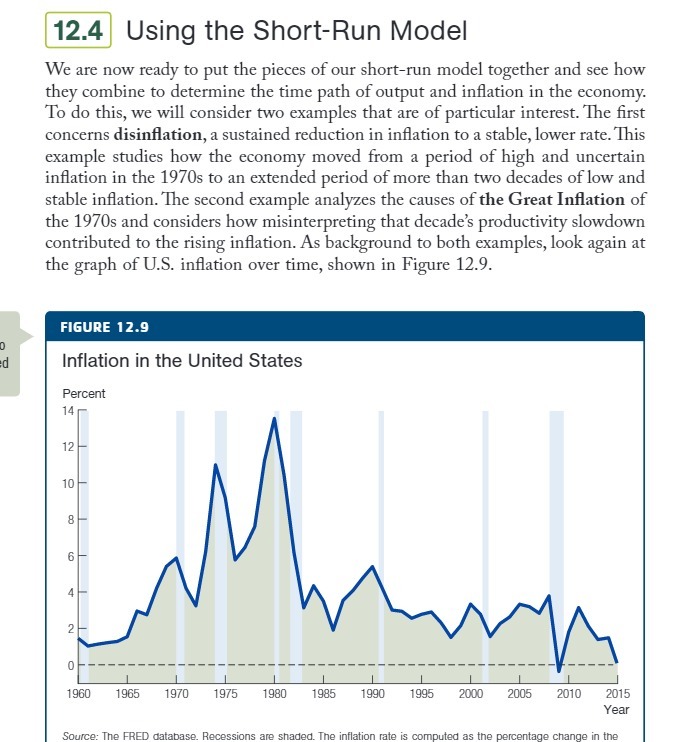
12.4 Using the Short-Run Model We are now ready to put the pieces of our short-run model together and see how they combine to determine the time path of output and inflation in the economy. To do this, we will consider two examples that are of particular interest. The first concerns disinflation, a sustained reduction in inflation to a stable, lower rate. This example studies how the economy moved from a period of high and uncertain inflation in the 1970s to an extended period of more than two decades of low and stable inflation. The second example analyzes the causes of the Great Inflation of the 1970s and considers how misinterpreting that decade's productivity slowdown contributed to the rising inflation. As background to both examples, look again at the graph of U.S. inflation over time, shown in Figure 12.9. FIGURE 12.9 Inflation in the United States Percent 14 12 10 8 4 2 1960 1965 1970 1975 1980 1985 1990 1995 2000 2005 2010 2015 Year Source: The FRED database. Recessions are shaded. The inflation rate is computed as the percentage change in the
Step by Step Solution
There are 3 Steps involved in it

Get step-by-step solutions from verified subject matter experts