

Question: 12:44 Done myopenmath.com AA C Chapter 8: Confidence Intervals (Proportions) Score: 0/6 0/6 answered Progress saved Done . . . . Question 2 0/1 pt
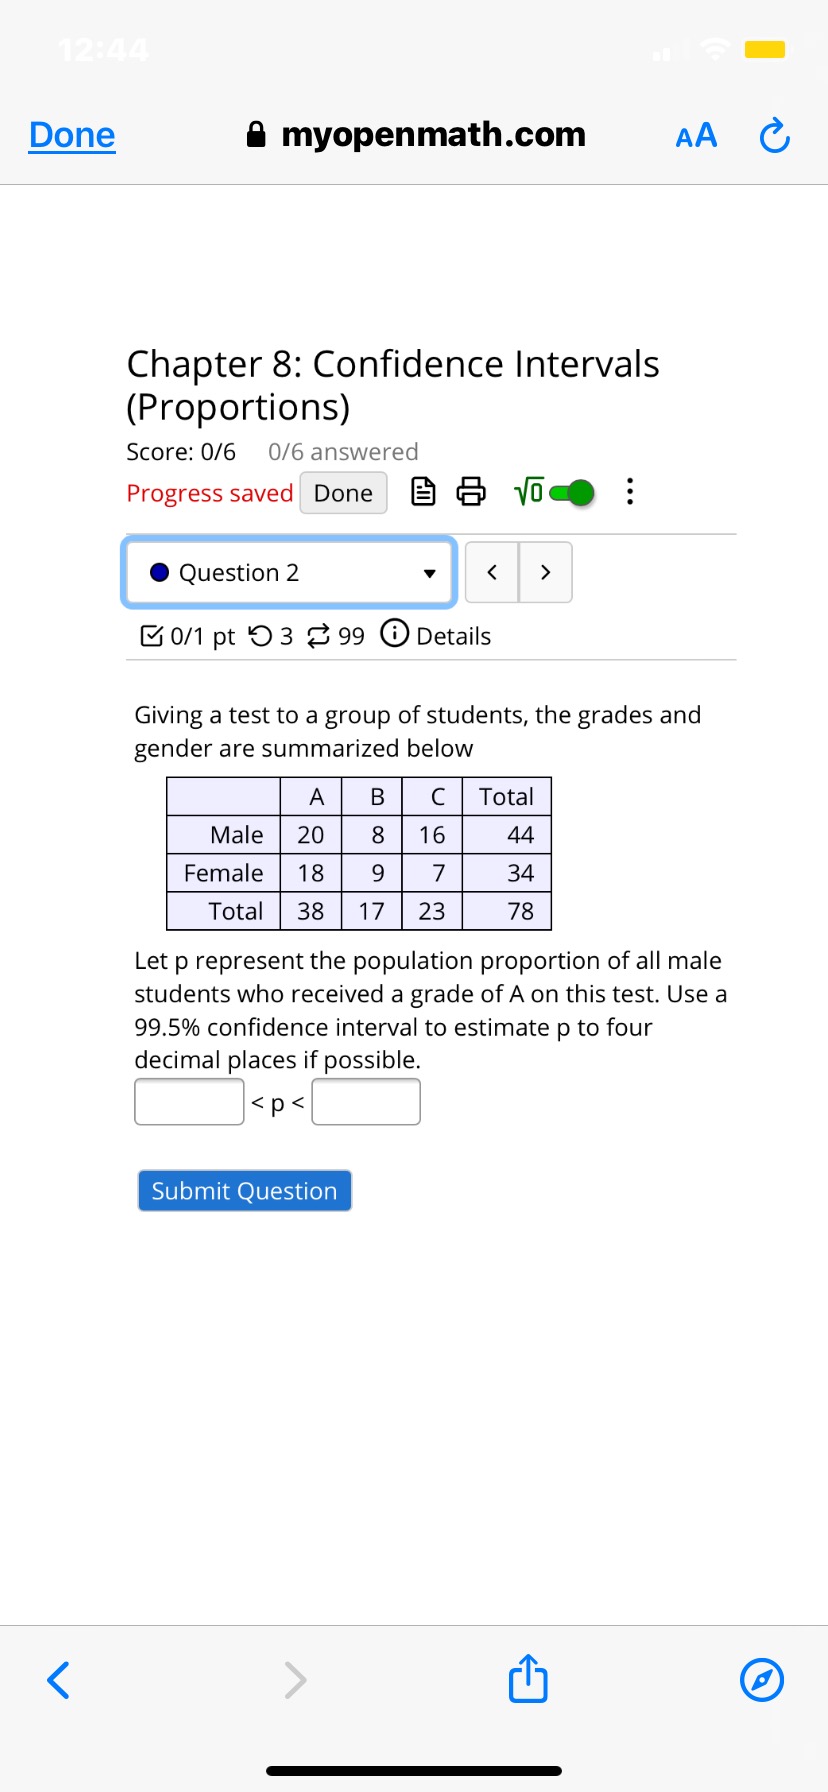
12:44 Done myopenmath.com AA C Chapter 8: Confidence Intervals (Proportions) Score: 0/6 0/6 answered Progress saved Done . . . . Question 2 0/1 pt 5 3 99 0 Details Giving a test to a group of students, the grades and gender are summarized below A B C Total Male 20 8 16 44 Female 18 9 7 34 Total 38 17 23 78 Let p represent the population proportion of all male students who received a grade of A on this test. Use a 99.5% confidence interval to estimate p to four decimal places if possible.
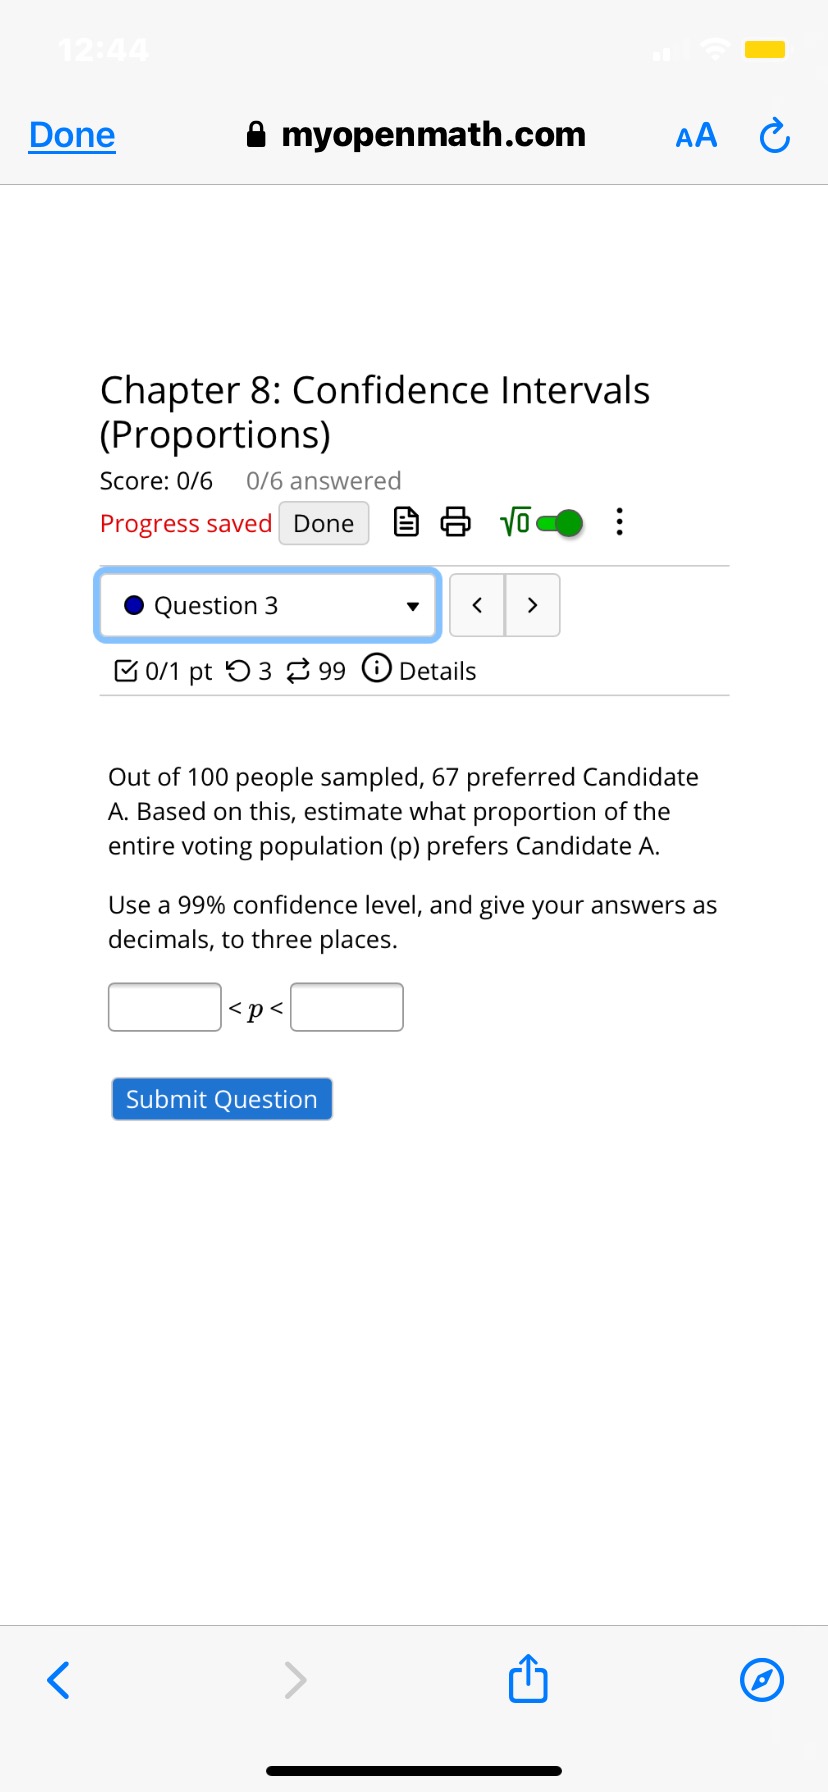
B 011 pt 0 3 8 99 (0 Details Out of 100 people sampled, 6? preferred Candidate A. Based on this, estimate what proportion of the entire voting population (p) prefers Candidate A. Use a 99% confidence level, and give your answers as decimals, to three places. [:]
Step by Step Solution
There are 3 Steps involved in it

Get step-by-step solutions from verified subject matter experts