Question: 125% % Zoom 1 ED Insert Table Table S Format Document View Add Page Chart Text Shape Media Comment Collaborate Questions Question Set 1. A
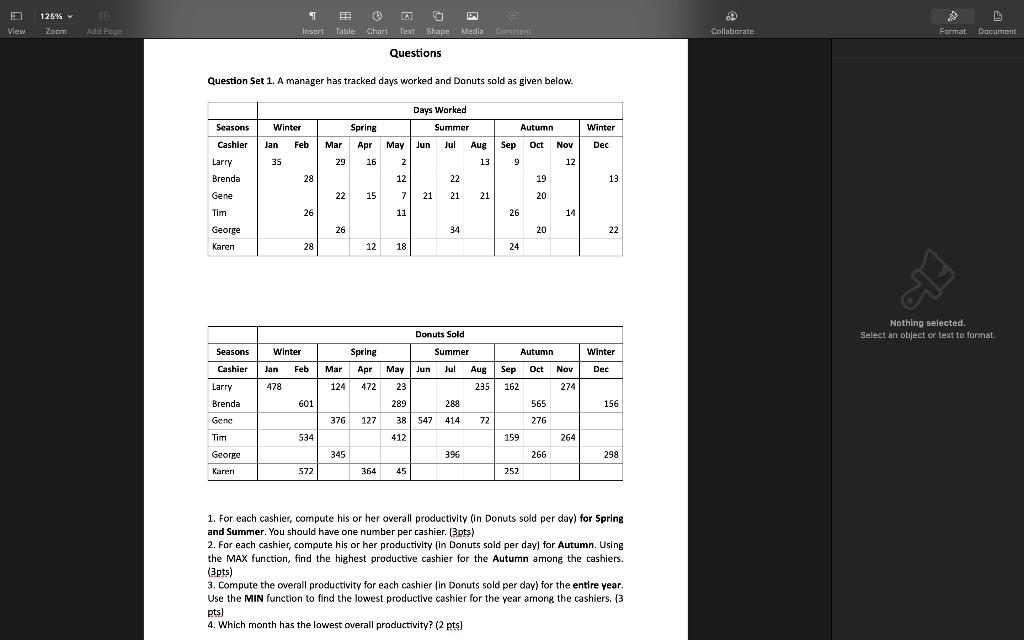
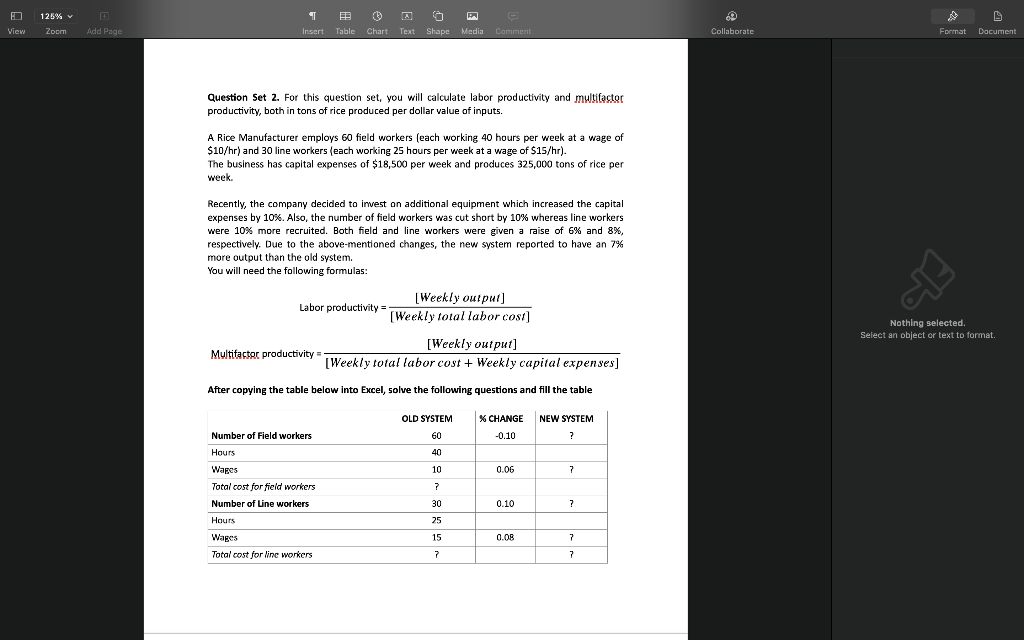
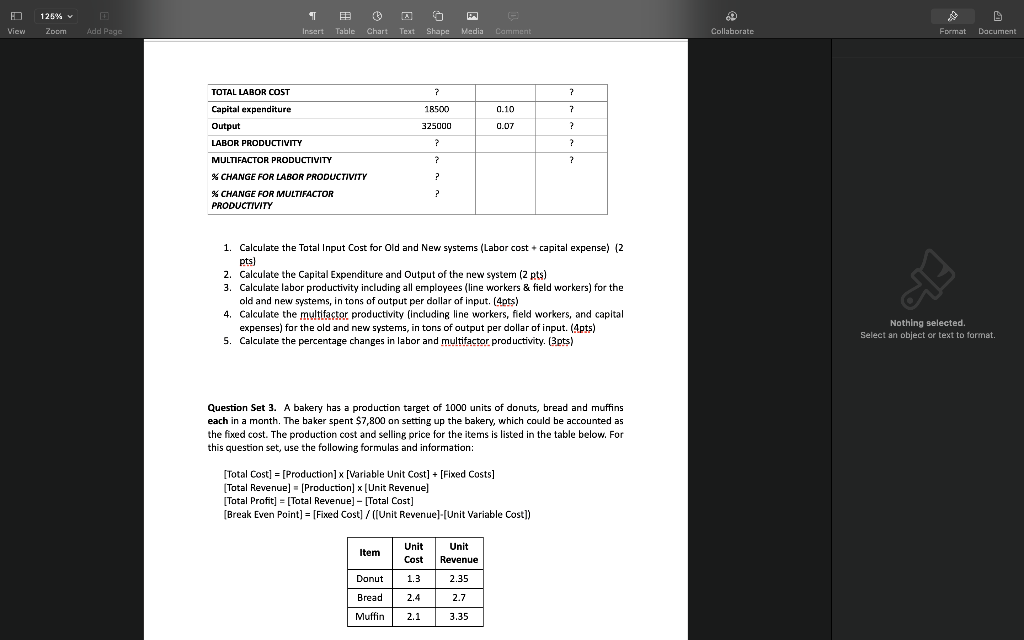
125% % Zoom 1 ED Insert Table Table S Format Document View Add Page Chart Text Shape Media Comment Collaborate Questions Question Set 1. A manager has tracked days worked and Donuts sold as given below. Days Worked Spring Summer Autumn Winter Winter Jan Feb Mar Apr May Jun Jul Sep Oct Nov Dec Seasons Cashier Larry Brenda Gene Aug 13 35 29 16 2 9 12 28 12 22 13 19 20 22 15 7 21 21 21 Tim 26 11 26 14 George 26 34 20 22 Karen 28 12 18 24 ah Nothing selected. . Select an object or text to format. Donuts Sold Winter Autumn Winter Seasons Cashier H Jan Feb Mar Spring Apr May 472 23 Summer Jun Jul Aug 235 Sep Oct Nov Dec 478 124 162 274 Larry Brenda 601 289 288 565 156 Genc 376 127 414 72 276 38 547 412 Tim 534 159 264 345 396 266 298 George Karen 572 364 45 252 1. For each cashier, compute his or her overall productivity (in Donuts sold per day) for Spring and Summer. You should have one number per cashier. (3pts) 2. For each cashier, compute his or her productivity (in Donuts sold per day) for Autumn. Using the MAX function, find the highest productive cashier for the Autumn among the cashiers. (3pts) 3. Compute the overall productivity for each cashier (in Donuts sold per day) for the entire year. Use the MIN function to find the lowest productive cashier for the year among the cashiers. (3 pts) 4. Which month has the lowest overall productivity? (2 pts) ? ( D 125% v 1 Insert Table Chart S Format Document View Zoom Add Page Text Shape Media Comment Collaborate Question Set 2. For this question set, you will calculate labor productivity and multifactor productivity, both in tons of rice produced per dollar value of inputs. A Rice Manufacturer employs 60 field workers (each working 40 hours per week at a wage of $10/hr) and 30 line workers (each working 25 hours per week at a wage of $15/hr). The business has capital expenses of $18,500 per week and produces 325,000 tons of rice per week. Recently, the company decided to invest on additional equipment which increased the capital expenses by 10%. Also, the number of field workers was cut short by 10% whereas line workers w were 10% more recruited. Both field and line workers were given a raise of 6% and 8%, % . 6% respectively. Due to the above-mentioned changes, the new system reported to have an 7% more output than the old system. You will need the following formulas: Ah Labor productivity [Weekly output) [Weekly total labor cosi] Nothing selected. . Select an object or text to format. Multifactor productivity [Weekly output) - [Weekly total labor cost + Weekly capital expenses] After copying the table below into Excel, solve the following questions and fill the table OLD SYSTEM NEW SYSTEM % CHANGE -0.10 7 Number of Field workers Hours 60 40 10 7 7 0.06 7 Wages Total cost for field workers Number of line workers Hours Wages 30 0.10 7 25 15 0.08 7 Total cost for line workers 7 7 D 125% % Zoom 1 Insert P Table S Format Document View Add Page Chart Text Shape Media Comment Collaborate TOTAL LABOR COST 7 ? Capital expenditure 18500 0.10 2 Output 325000 0.07 ? LABOR PRODUCTIVITY ? ? ? ? ? ? MULTIFACTOR PRODUCTIVITY % CHANGE FOR LABOR PRODUCTIVITY % CHANGE FOR MULTIFACTOR PRODUCTIVITY ? Eb 1. Calculate the Total Input Cost for Old and New systems (Labor cost capital expense) (2 pts) 2. Calculate the Capital Expenditure and Output of the new system (2 pts) 3. Calculate labor productivity including all employees (line workers & field workers) for the old and new systems, in tons of output per dollar of input. (4pts) 4. Calculate the multifactor productivity (including line workers, field workers, and capital expenses) for the old and new systems, in tons of output per dollar of input. (4pts) 5. Calculate the percentage changes in labor and multifactor productivity. (3pts) Nothing selected. . Select an object or text to format. Question Set 3. A bakery has a production target of 1000 units of donuts, bread and muffins each in a month. The baker spent $7,800 on setting up the bakery, which could be accounted as the fixed cost. The production cost and selling price for the items is listed in the table below. For this question set, use the following formulas and information: [Total Cost] = [Production] x [Variable Unit Cost] + [Fixed Costs] [Total Revenue) - [Production] x [Unit Revenue) [Total Profit] = [Total Revenue) - Total Cost] [Break Even Point] = [Fixed Cost] / ((Unit Revenue)-(Unit Variable Cost]) Item Unit Cost Unit Revenue Donut 1.3 2.35 Bread 2.4 2.7 Muffin 2.1 3.35 125% Zoom Insert Table Chart Text Shape Media Commer View Add Page Collaborate Format Document 1. Calculate Total profit for the bakery in a month, given they bake 1000 units each of all 3 products (3pts) 2. Create a data table (as demonstrated during lab exercise 2), to show the change Total profit corresponding to change in Production from 2000 to 3500 units with increments of 100. You must use a data table structure to receive credit for this problem. (6pts) 3. Create a scatter chart that displays the variable total profit (and no other variables) as a function of Production. At low production quantities, total profit may be negative but should still be displayed. Label your chart axes appropriately. (3pts) 4. What is the break-even point? (The Production for which the Total profit is zero) (2 pts) ab Nothing selected. Select an object or text to format


