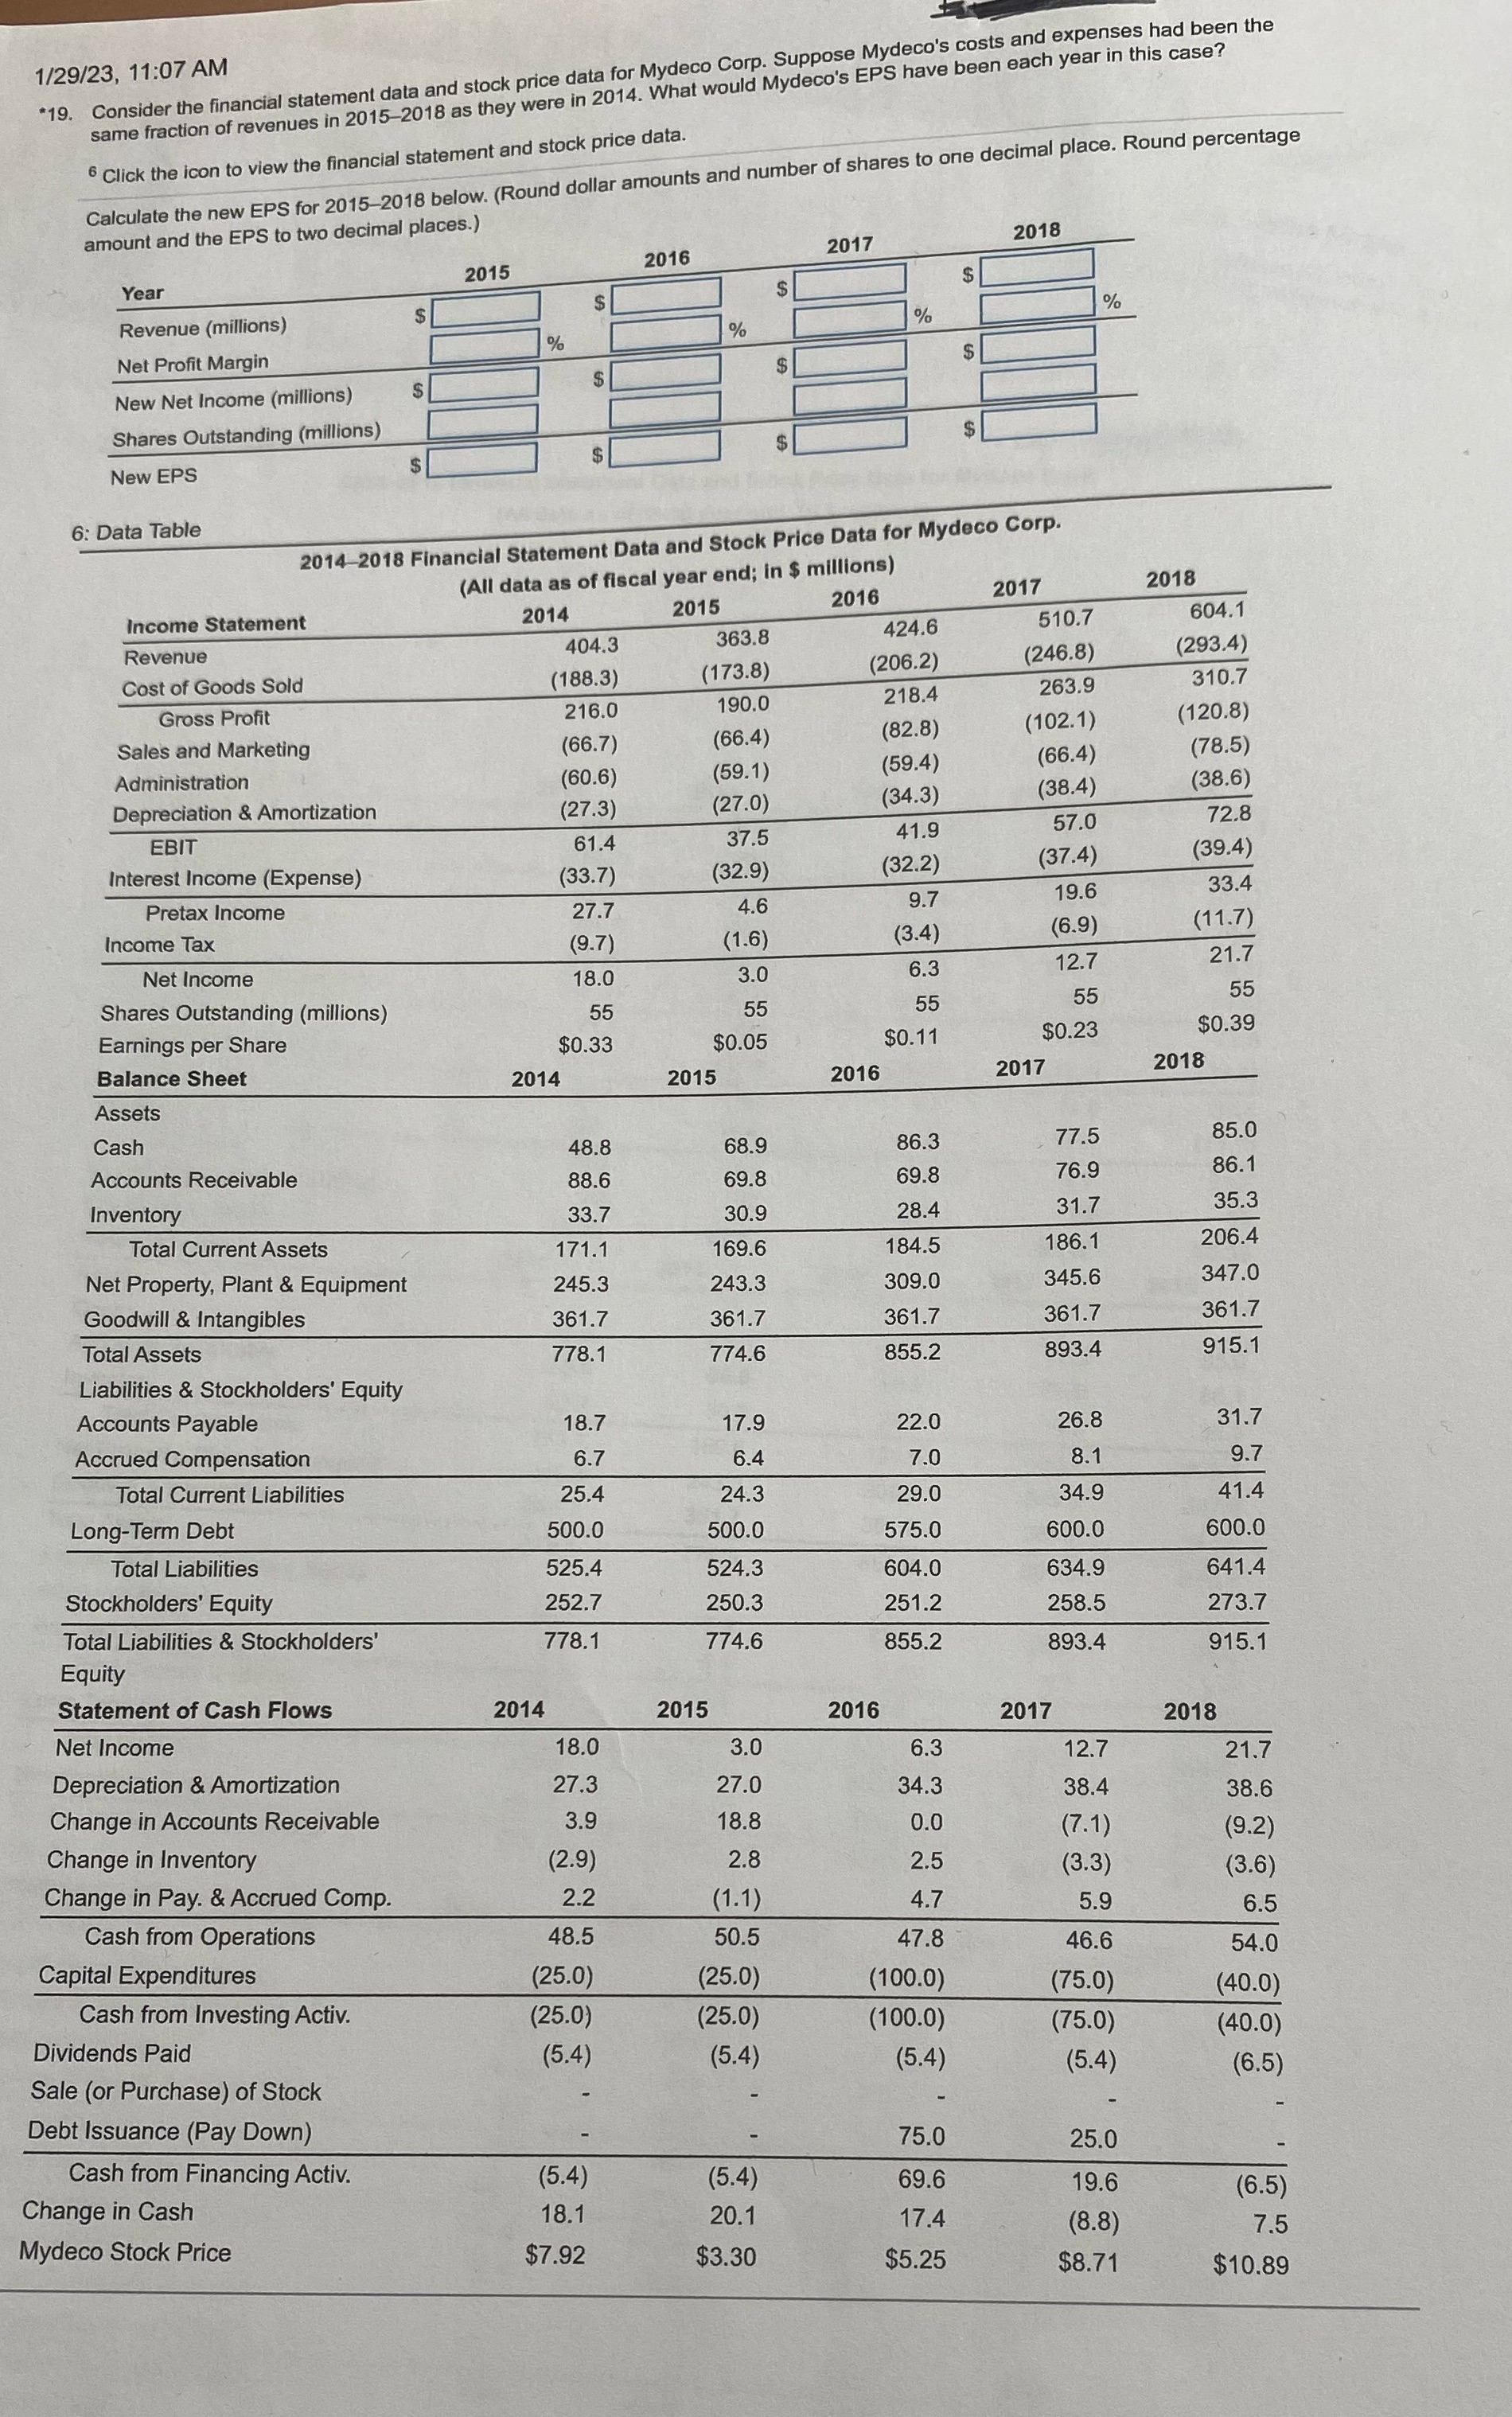
Question: 1/29/23, 11:07 AM *19. Consider the financial statement data and stock price data for Mydeco Corp. Suppose Mydeco's costs and expenses had been the same

1/29/23, 11:07 AM *19. Consider the financial
1/29/23, 11:07 AM *19. Consider the financial statement data and stock price data for Mydeco Corp. Suppose Mydeco's costs and expenses had been the same fraction of revenues in 2015-2018 as they were in 2014. What would Mydeco's EPS have been each year in this case? Click the icon to view the financial statement and stock price data. Calculate the new EPS for 2015-2018 below. (Round dollar amounts and number of shares to one decimal place. Round percentage amount and the EPS to two decimal places.) 2018 2017 2016 2015 $ Year $ Revenue (millions) % Net Profit Margin New Net Income (millions) S Shares Outstanding (millions) New EPS 6: Data Table 2014-2018 Financial Statement Data and Stock Price Data for Mydeco Corp. (All data as of fiscal year end; in $ millions) 2017 2018 Income Statement 2014 2015 2016 424.6 510.7 604.1 Revenue 404.3 363.8 293.4) (206.2) (246.8) Cost of Goods Sold (188.3) (173.8) 263.9 310.7 216.0 190.0 218.4 Gross Profit (66.4) (82.8) (102.1) (120.8) Sales and Marketing (66.7) (78.5) (59.1) (59.4) (66.4) Administration (60.6) 38.4) (38.6) Depreciation & Amortization 27.3) (27.0) (34.3) 72.8 41.9 57.0 EBIT 61.4 37.5 (39.4) Interest Income (Expense) (33.7) (32.9) (32.2) (37.4) 33.4 Pretax Income 27.7 4.6 9.7 19.6 (6.9) (11.7) Income Tax 9.7) 1.6) (3.4) 21.7 3.0 6.3 12.7 Net Income 8.0 Shares Outstanding (millions) 55 55 55 55 55 $0.23 $0.39 Earnings per Share $0.33 $0.05 $0.11 2018 Balance Sheet 2014 2015 2016 2017 Assets Cash 48.8 68.9 86.3 77.5 85.0 86.1 Accounts Receivable 88.6 69.8 69.8 76.9 Inventory 35.3 33.7 30.9 28.4 31.7 Total Current Assets 171.1 169.6 184.5 186.1 206.4 Net Property, Plant & Equipment 245.3 243.3 309.0 345.6 347.0 Goodwill & Intangibles 361.7 361.7 361.7 361.7 361.7 Total Assets 778.1 774.6 855.2 893.4 915.1 Liabilities & Stockholders' Equity Accounts Payable 18.7 17.9 22.0 26.8 31.7 Accrued Compensation 6.7 6.4 7.0 8.1 9.7 Total Current Liabilities 25.4 24.3 29.0 34.9 41.4 Long-Term Debt 500. 500. 575.0 600.0 600. Total Liabilities 525.4 524.3 604.0 534.9 541.4 Stockholders' Equity 252.7 250.3 251.2 258.5 273.7 Total Liabilities & Stockholders' 778.1 774.6 855.2 893.4 915.1 Equity Statement of Cash Flows 2014 2015 2016 2017 2018 Net Income 18.0 3.0 6.3 12.7 21.7 Depreciation & Amortization 27.3 27.0 34.3 38.4 38.6 Change in Accounts Receivable 3.9 18.8 0.0 (7.1) (9.2) Change in Inventory (2.9 2.8 2.5 (3.3) 3.6) Change in Pay. & Accrued Comp. 2.2 (1.1) 4.7 5.9 6.5 Cash from Operations 18.5 50.5 47.8 46.6 54.0 Capital Expenditures (25.0 (25.0) (100.0) (75.0) (40.0) Cash from Investing Activ. (25.0) (25.0) (100.0) 75.0 (40.0) Dividends Paid (5.4) (5.4) (5.4) (5.4) 6.5) Sale (or Purchase) of Stock Debt Issuance (Pay Down) 75.0 25.0 Cash from Financing Activ. (5.4) (5.4) 69.6 19.6 6.5 Change in Cash 18.1 20.1 17.4 (8.8) 7.5 Mydeco Stock Price $7.92 $3.30 $5.25 $8.71 $10.89

Step by Step Solution

There are 3 Steps involved in it

1 Expert Approved Answer
Step: 1 Unlock blur-text-image
Question Has Been Solved by an Expert!

Get step-by-step solutions from verified subject matter experts

Step: 2 Unlock
Step: 3 Unlock

Students Have Also Explored These Related Accounting Questions!