

Question: 13 6 140% 3. Educators are constantly evaluating the efficacy of public schools in the education. To check how average math SAT scores changes over
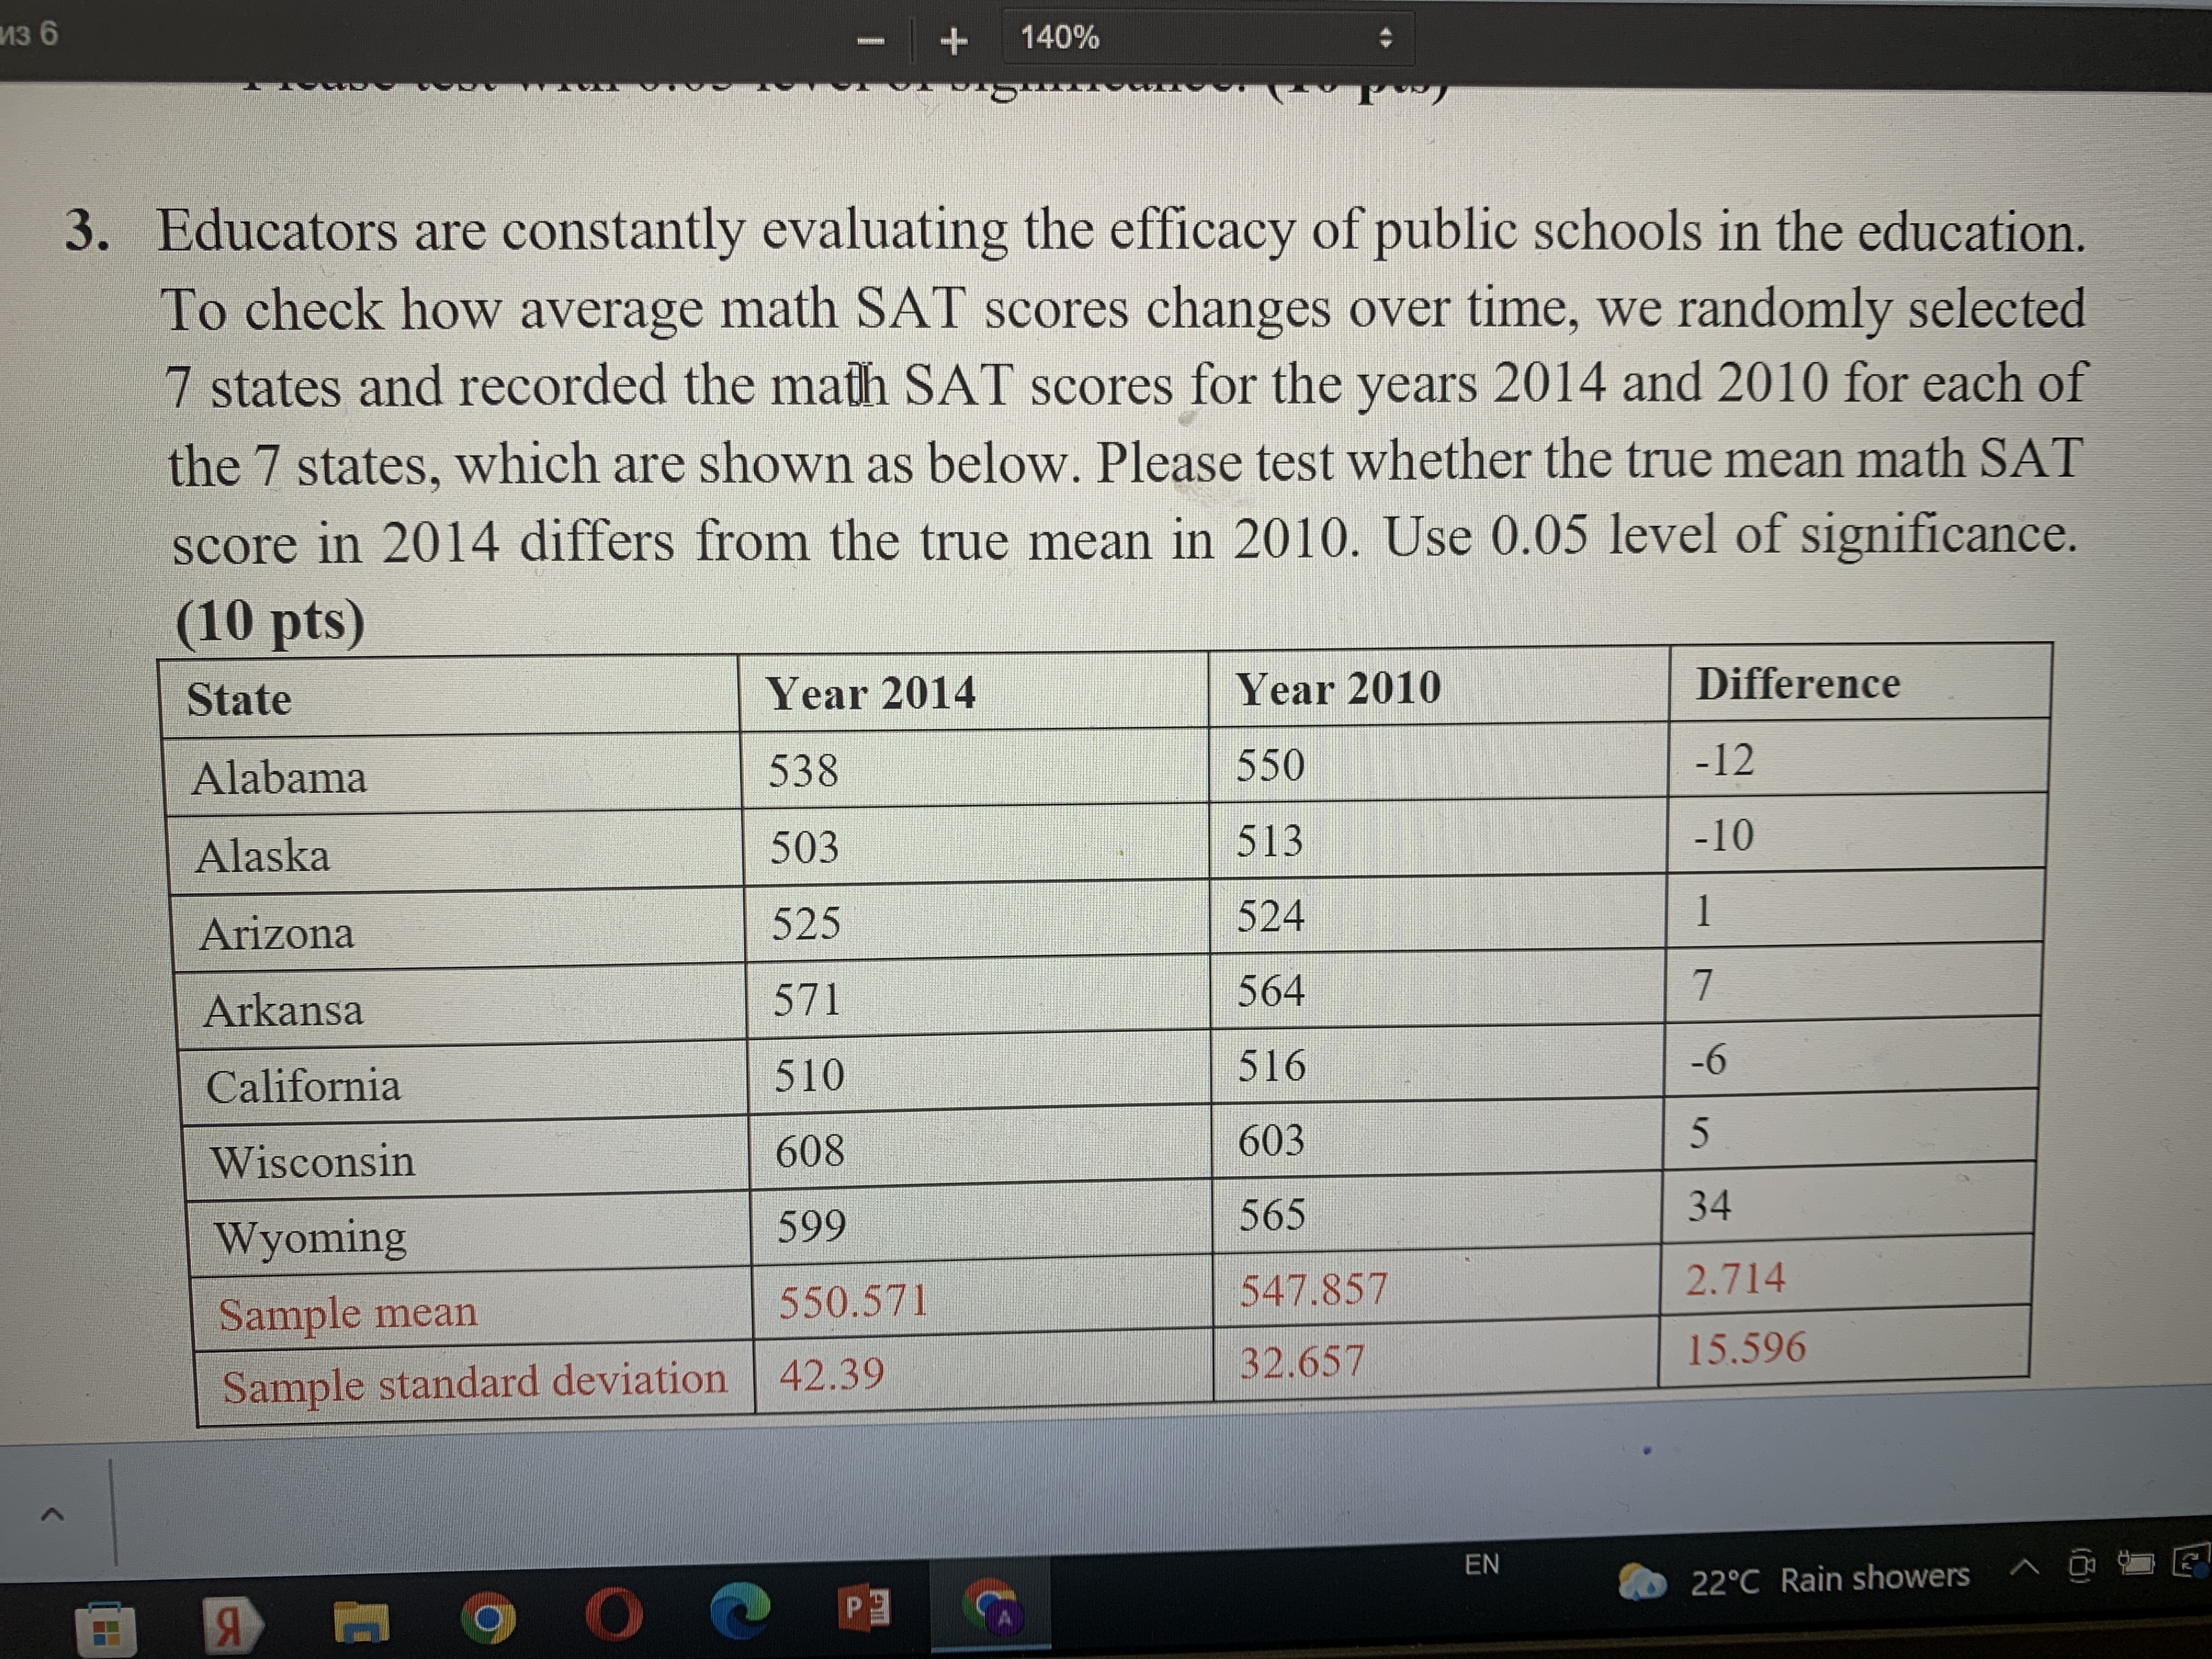
13 6 140% 3. Educators are constantly evaluating the efficacy of public schools in the education. To check how average math SAT scores changes over time, we randomly selected 7 states and recorded the math SAT scores for the years 2014 and 2010 for each of the 7 states, which are shown as below. Please test whether the true mean math SAT score in 2014 differs from the true mean in 2010. Use 0.05 level of significance. (10 pts) State Year 2014 Year 2010 Difference Alabama 538 550 12 Alaska 503 513 -10 Arizona 525 524 Arkansa 571 564 7 California 510 516 -6 Wisconsin 608 603 5 Wyoming 599 565 34 Sample mean 550.571 547.857 2.714 Sample standard deviation 42.39 32.657 15.596 EN O Ed 22C Rain showers
Step by Step Solution
There are 3 Steps involved in it

Get step-by-step solutions from verified subject matter experts