

Question: The board is expecting a regular growth each year. Our expert says that, although not certain, growth between -2% and 5% per year is
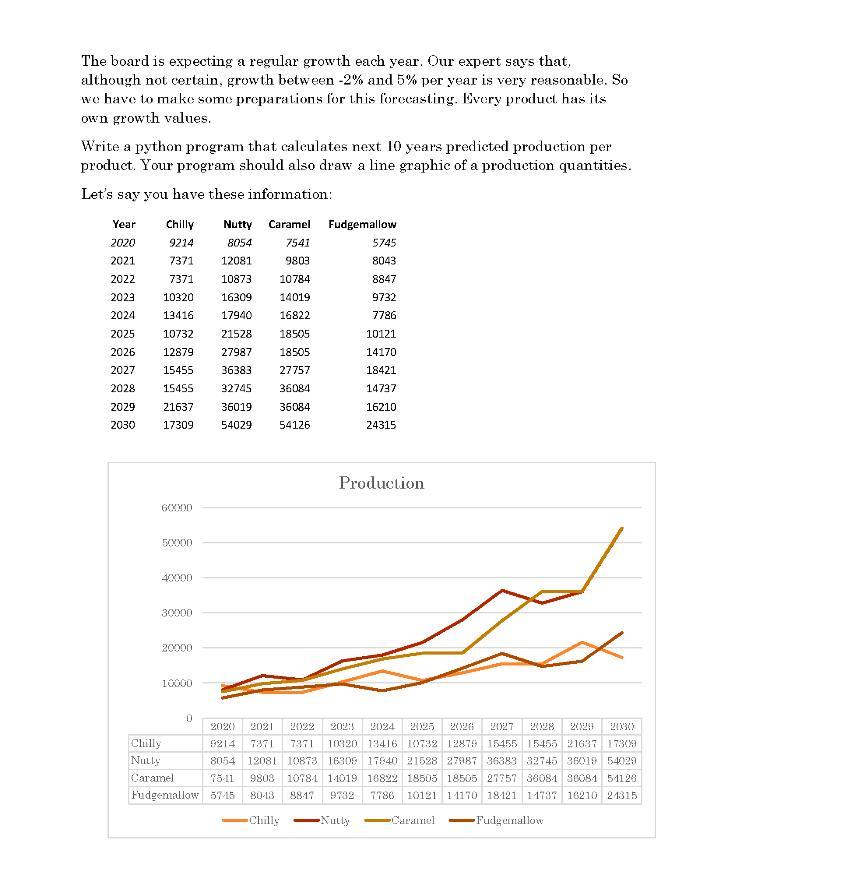
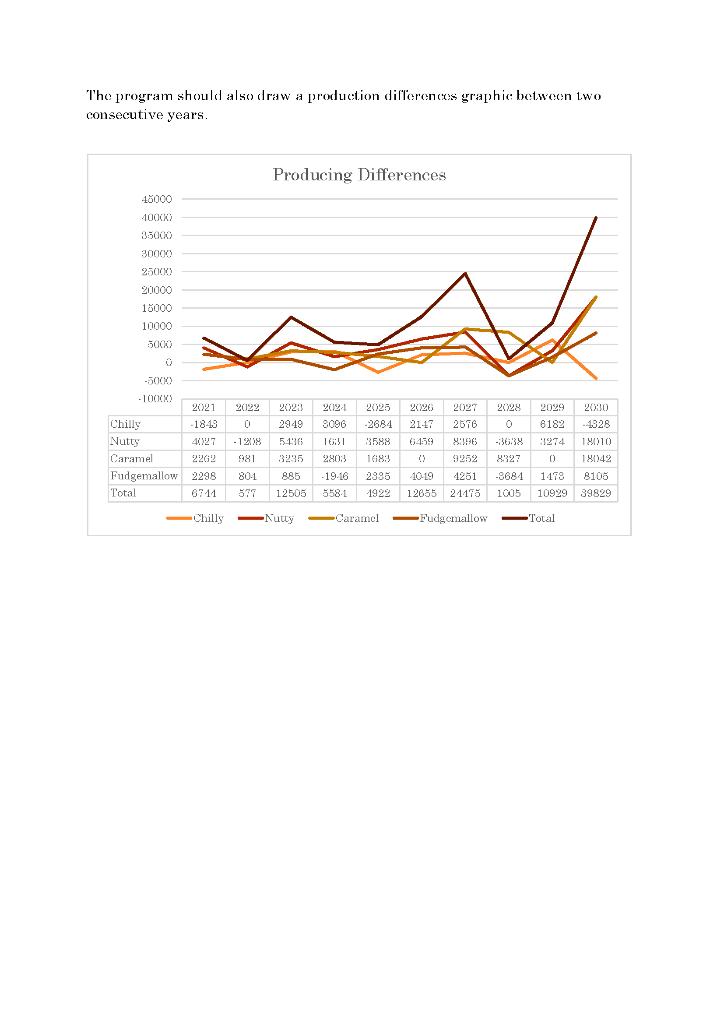
The board is expecting a regular growth each year. Our expert says that, although not certain, growth between -2% and 5% per year is very reasonable. So we have to make some preparations for this forecasting. Every product has its own growth values. Write a python program that calculates next 10 years predicted production per product. Your program should also draw a line graphic of a production quantities. Let's say you have these information: Year 2020 2021 2022 2023 2024 2025 2026 2027 2028 2029 2030 Chilly Nutty Caramel Fudgemallow 9214 8054 7541 7371 12081 9803 7371 10873 10784 10320 16309. 14019 13416 17940 16822 10732 21528 18505 12879 27987 18505 15455 36383 27757 15455 32745 36084 21637 36019 36084 17309 54029 54126 60000 50000 40000 30000 20000 10000 0 5745 8043 8847 9732 7786 10121 14170 18421 14737 16210 24315 Production 2023 2024 2025 2026 2020 2021 2022 2027 2028 2029 2483) Chilly 9214 7371 7371 10320 13416 10732 12879 15455 15455 21637 17309 Nully 8054 12081 10873 16309 17840 21528 27987 36383 32745 36019 54029 Caramel 75-11 9803 10784 14019 16822 18505 18505 27757 36084 36084 51126 Fudgemallow 57-15 80-13 8817 9732 7786 10121 11170 18121 11737 16210 21315 Chilly -Nutty Caramel - Fudgeimallow The program should also draw a production differences graphic between two consecutive years. 48000 40000 35000 30000 25000 20000 18000 10000 5000 Total -5000 -100(X) Producing Differences 2024 2023 2025 2026 2027 2949 8096 -2684 21-47 2576 2021 2022 Chilly -1843 0 4027 -1208 5436 16:31 3588 6439 981 3235 2803 1683 2262 Nutty Caramel Fudgemallow 2298 80-1 885 -19-16 2395 6711 577 12505 558-1 1922 Chilly -Nutty 2028 2029 2030 18010 0 6182 -4328 8396 -3638 1274 9252 8327 0. 18042 40-19 4251 -3684 1478 8105 12655 21175 1005 10929 39829 - Fudgemallow Caramel Total
Step by Step Solution
3.59 Rating (152 Votes )
There are 3 Steps involved in it
Based on the context provided the task is to write a Python program that calculates the next 10 year... View full answer

Get step-by-step solutions from verified subject matter experts