

Question: 13. CAPM and Expected Return. Suppose that the Treasury bill rate is 6% rather than the 1% value assumed in Table 12.2. Use the betas
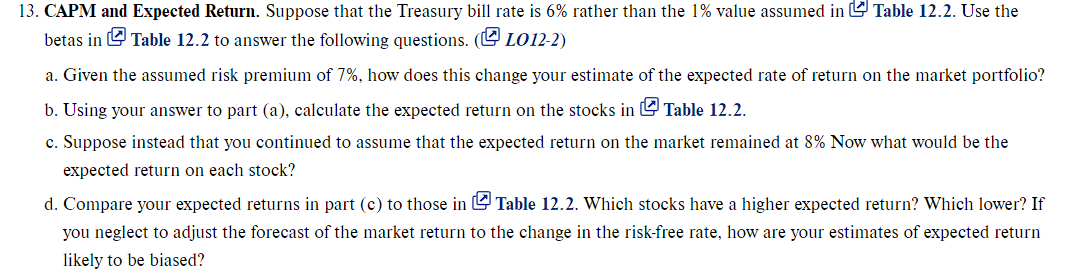
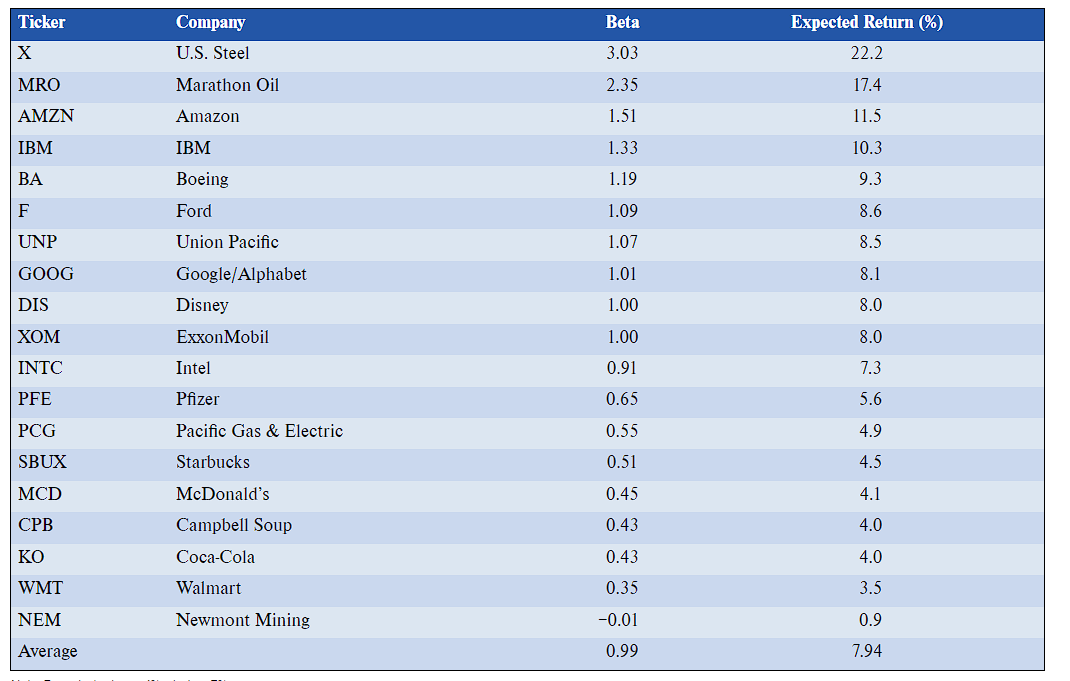
13. CAPM and Expected Return. Suppose that the Treasury bill rate is 6% rather than the 1% value assumed in Table 12.2. Use the betas in [ : Table 12.2 to answer the following questions. ( LO12-2) a. Given the assumed risk premium of 7%, how does this change your estimate of the expected rate of return on the market portfolio? b. Using your answer to part (a), calculate the expected return on the stocks in Table 12.2. c. Suppose instead that you continued to assume that the expected return on the market remained at 8% Now what would be the expected return on each stock? d. Compare your expected returns in part (c) to those in [] Table 12.2. Which stocks have a higher expected return? Which lower? If you neglect to adjust the forecast of the market return to the change in the risk-free rate, how are your estimates of expected return likely to be biased? \begin{tabular}{|llcc|} \hline Ticker & Company & Beta & Expected Return (\%) \\ \hline X & U.S. Steel & 3.03 & 22.2 \\ MRO & Marathon Oil & 2.35 & 17.4 \\ AMZN & Amazon & 1.51 & 11.5 \\ IBM & IBM & 1.33 & 10.3 \\ BA & Boeing & 1.19 & 9.3 \\ F & Ford & 1.09 & 8.6 \\ UNP & Union Pacific & 1.07 & 8.5 \\ GOOG & Google/Alphabet & 8.1 \\ DIS & Disney & 1.01 & 8.0 \\ XOM & ExxonMobil & 1.00 & 8.0 \\ INTC & Intel & 1.00 & 7.3 \\ PFE & Pfizer & 0.91 & 5.6 \\ PCG & Pacific Gas \& Electric & 0.65 & 4.9 \\ SBUX & Starbucks & 0.55 & 4.5 \\ MCD & McDonald's & 0.51 & 4.1 \\ CPB & Campbell Soup & 0.45 & 4.0 \\ KO & Coca-Cola & 0.43 & 4.9 \\ WMT & Walmart & 0.43 & 0.35 \\ NEM & Newmont Mining & -0.01 & 0.99 \\ Average & & 0.9 & \\ \hline \end{tabular} 13. CAPM and Expected Return. Suppose that the Treasury bill rate is 6% rather than the 1% value assumed in Table 12.2. Use the betas in [ : Table 12.2 to answer the following questions. ( LO12-2) a. Given the assumed risk premium of 7%, how does this change your estimate of the expected rate of return on the market portfolio? b. Using your answer to part (a), calculate the expected return on the stocks in Table 12.2. c. Suppose instead that you continued to assume that the expected return on the market remained at 8% Now what would be the expected return on each stock? d. Compare your expected returns in part (c) to those in [] Table 12.2. Which stocks have a higher expected return? Which lower? If you neglect to adjust the forecast of the market return to the change in the risk-free rate, how are your estimates of expected return likely to be biased? \begin{tabular}{|llcc|} \hline Ticker & Company & Beta & Expected Return (\%) \\ \hline X & U.S. Steel & 3.03 & 22.2 \\ MRO & Marathon Oil & 2.35 & 17.4 \\ AMZN & Amazon & 1.51 & 11.5 \\ IBM & IBM & 1.33 & 10.3 \\ BA & Boeing & 1.19 & 9.3 \\ F & Ford & 1.09 & 8.6 \\ UNP & Union Pacific & 1.07 & 8.5 \\ GOOG & Google/Alphabet & 8.1 \\ DIS & Disney & 1.01 & 8.0 \\ XOM & ExxonMobil & 1.00 & 8.0 \\ INTC & Intel & 1.00 & 7.3 \\ PFE & Pfizer & 0.91 & 5.6 \\ PCG & Pacific Gas \& Electric & 0.65 & 4.9 \\ SBUX & Starbucks & 0.55 & 4.5 \\ MCD & McDonald's & 0.51 & 4.1 \\ CPB & Campbell Soup & 0.45 & 4.0 \\ KO & Coca-Cola & 0.43 & 4.9 \\ WMT & Walmart & 0.43 & 0.35 \\ NEM & Newmont Mining & -0.01 & 0.99 \\ Average & & 0.9 & \\ \hline \end{tabular}
Step by Step Solution
There are 3 Steps involved in it

Get step-by-step solutions from verified subject matter experts