

Question: 13. Fill in the blank. P(5) = Explain what both numbers in this statement mean. Math Note It might strike you as odd that the
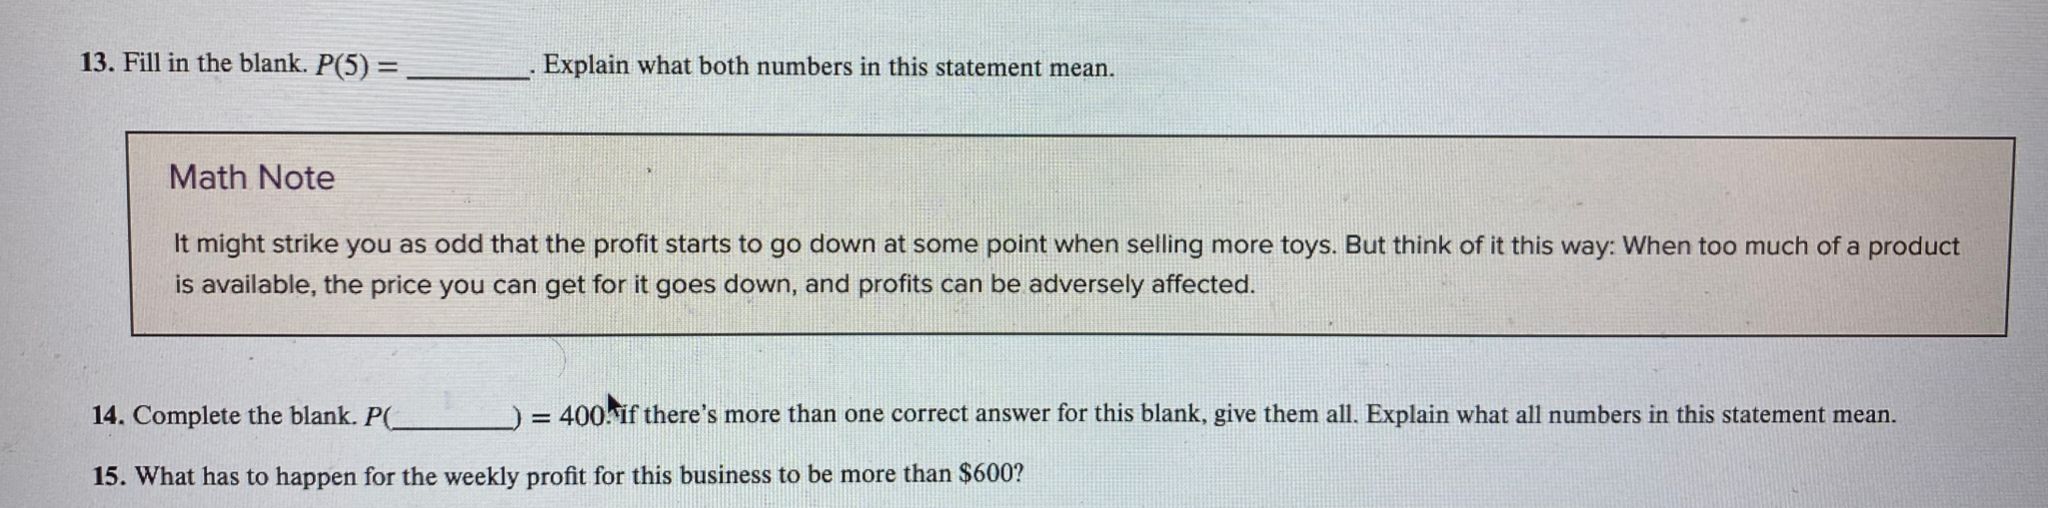
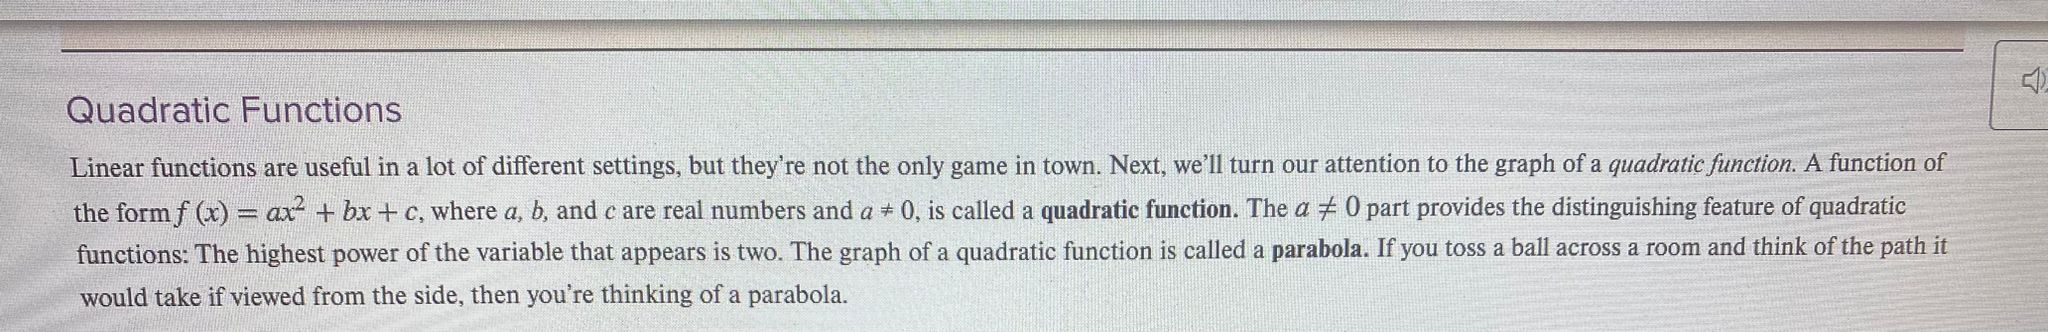
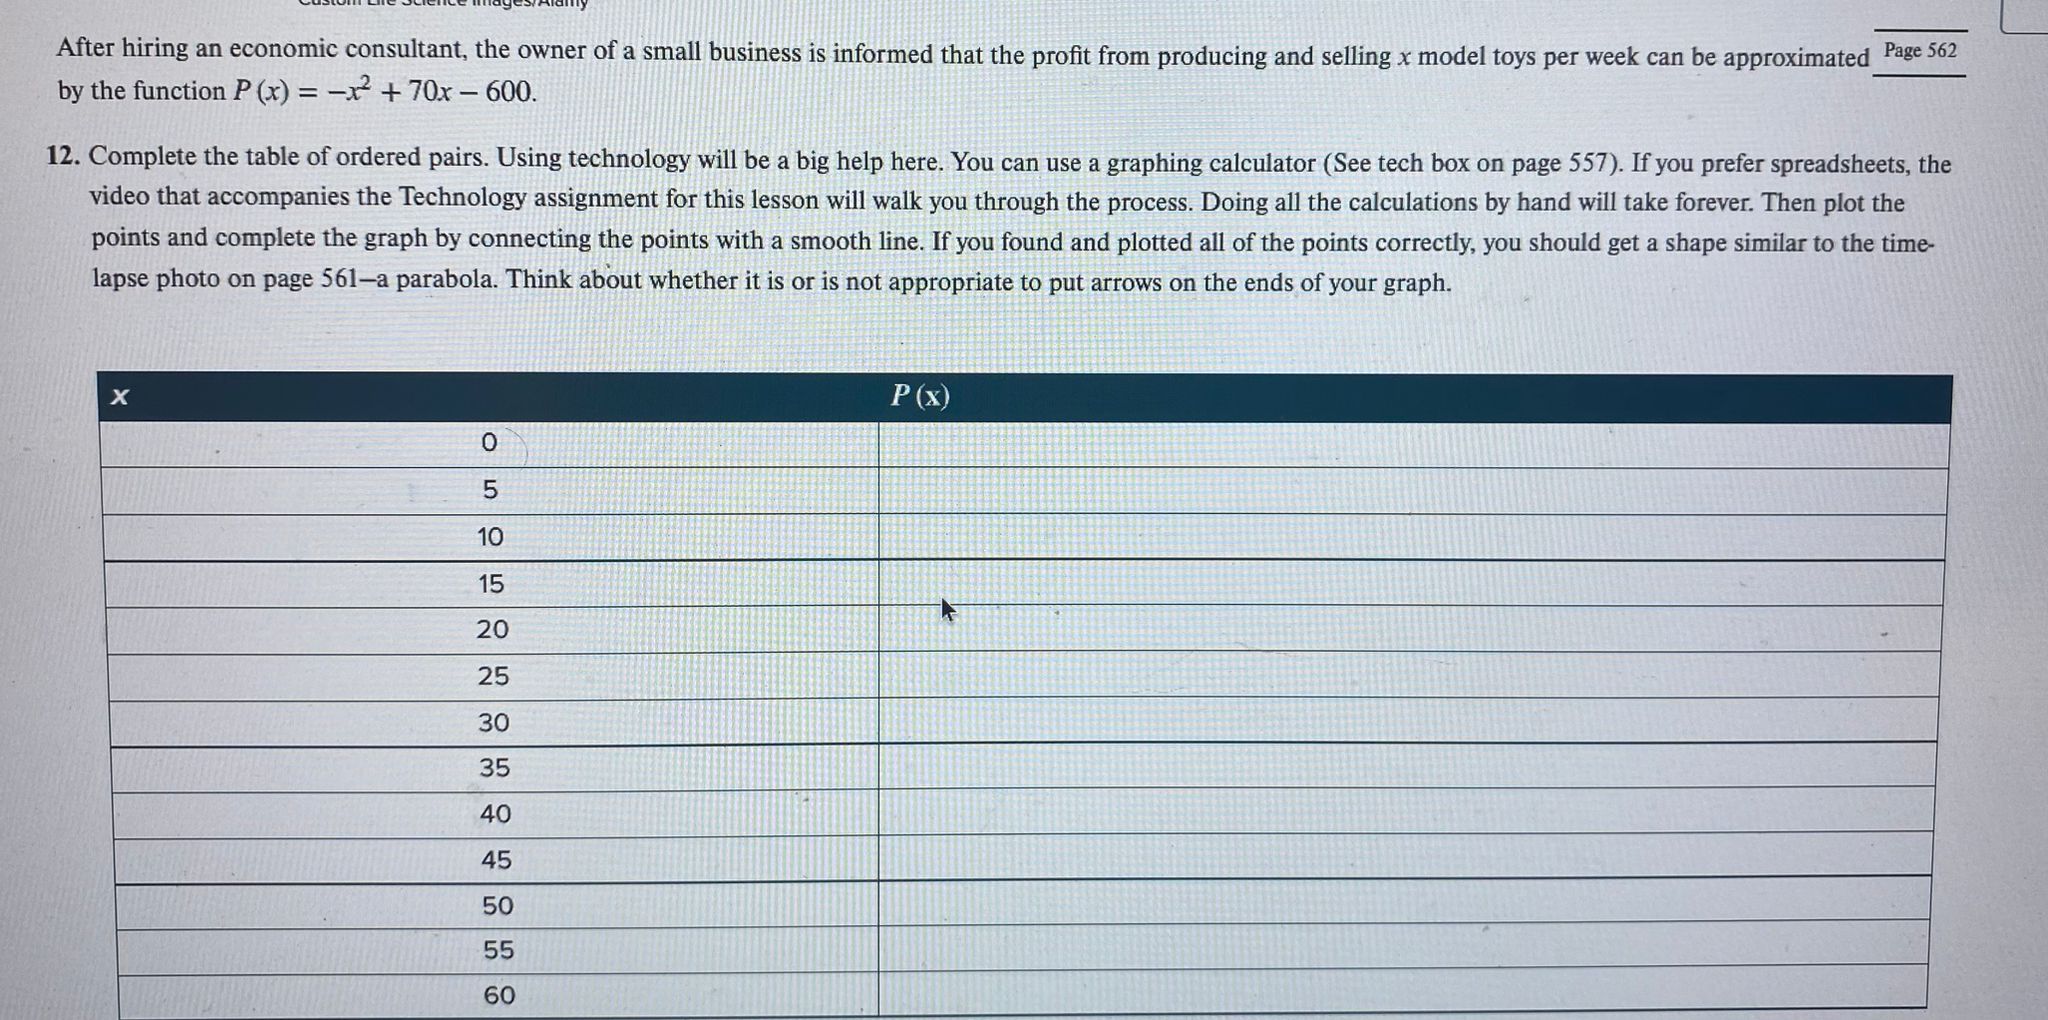
13. Fill in the blank. P(5) = Explain what both numbers in this statement mean. Math Note It might strike you as odd that the profit starts to go down at some point when selling more toys. But think of it this way: When too much of a product is available, the price you can get for it goes down, and profits can be adversely affected. 14. Complete the blank. P( _) = 400. if there's more than one correct answer for this blank, give them all. Explain what all numbers in this statement mean. 15. What has to happen for the weekly profit for this business to be more than $600?Quadratic Functions Linear functions are useful in a lot of different settings, but they're not the only game in town. Next, we'll turn our attention to the graph of a quadratic function. A function of the form f (x) = ax- + bx + c, where a, b, and c are real numbers and a # 0, is called a quadratic function. The a # 0 part provides the distinguishing feature of quadratic functions: The highest power of the variable that appears is two. The graph of a quadratic function is called a parabola. If you toss a ball across a room and think of the path it would take if viewed from the side, then you're thinking of a parabola.After hiring an economic consultant, the owner of a small business is informed that the profit from producing and selling x model toys per week can be approximated Page 562 by the function P (x) = -x2 + 70x - 600. 12. Complete the table of ordered pairs. Using technology will be a big help here. You can use a graphing calculator (See tech box on page 557). If you prefer spreadsheets, the video that accompanies the Technology assignment for this lesson will walk you through the process. Doing all the calculations by hand will take forever. Then plot the points and complete the graph by connecting the points with a smooth line. If you found and plotted all of the points correctly, you should get a shape similar to the time- lapse photo on page 561-a parabola. Think about whether it is or is not appropriate to put arrows on the ends of your graph. X P(x) 5 10 15 20 25 30 35 40 45 50 55 60
Step by Step Solution
There are 3 Steps involved in it

Get step-by-step solutions from verified subject matter experts