

Question: 13 (socal 7. Explain what it means for a regression line to be the least squares regression line. What is special about this particular line?
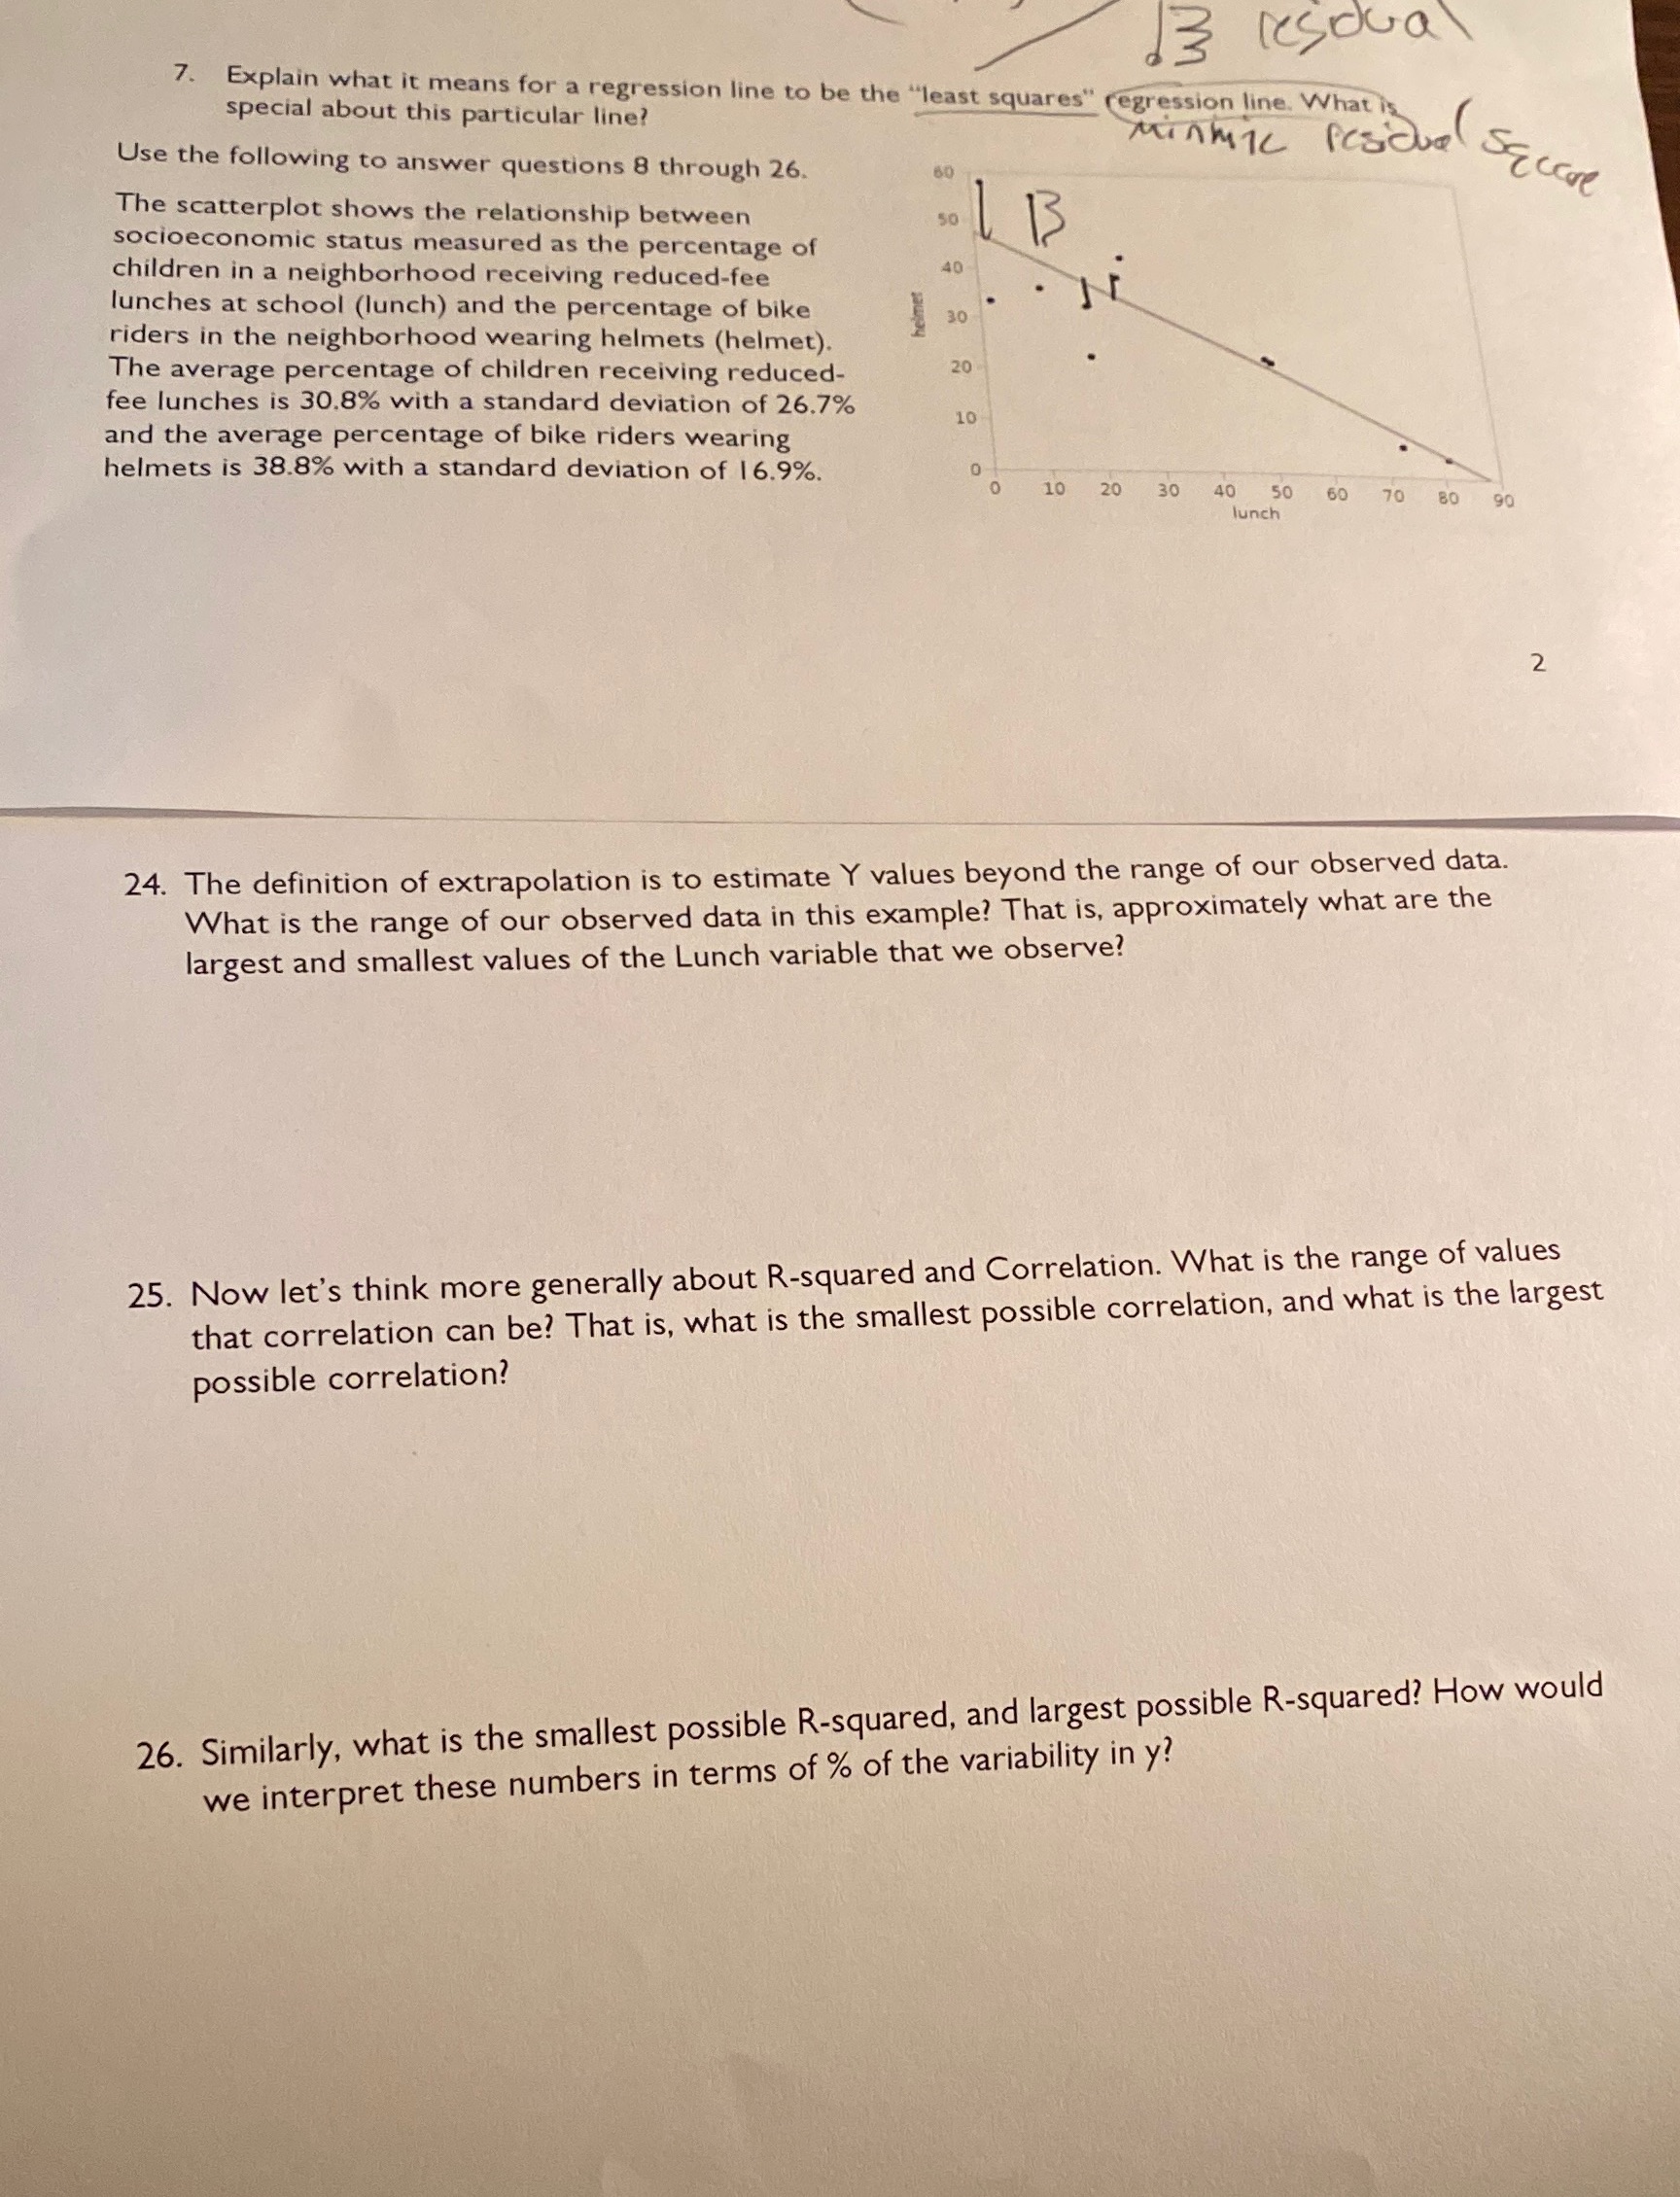
13 (socal 7. Explain what it means for a regression line to be the "least squares" regression line. What is special about this particular line? Use the following to answer questions 8 through 26. Minhize Residue Seccore The scatterplot shows the relationship between 1 B socioeconomic status measured as the percentage of 40 children in a neighborhood receiving reduced-fee lunches at school (lunch) and the percentage of bike 30 riders in the neighborhood wearing helmets (helmet). The average percentage of children receiving reduced- 20 fee lunches is 30.8% with a standard deviation of 26.7% LO and the average percentage of bike riders wearing helmets is 38.8% with a standard deviation of 16.9%. O 10 20 30 40 50 60 70 80 90 lunch 2 24. The definition of extrapolation is to estimate Y values beyond the range of our observed data. What is the range of our observed data in this example? That is, approximately what are the largest and smallest values of the Lunch variable that we observe? 25. Now let's think more generally about R-squared and Correlation. What is the range of values that correlation can be? That is, what is the smallest possible correlation, and what is the largest possible correlation? 26. Similarly, what is the smallest possible R-squared, and largest possible R-squared? How would we interpret these numbers in terms of % of the variability in y
Step by Step Solution
There are 3 Steps involved in it

Get step-by-step solutions from verified subject matter experts